Vodafone 2005 Annual Report Download - page 130
Download and view the complete annual report
Please find page 130 of the 2005 Vodafone annual report below. You can navigate through the pages in the report by either clicking on the pages listed below, or by using the keyword search tool below to find specific information within the annual report.-
 1
1 -
2
-
3
-
4
-
5
-
6
-
7
-
8
-
9
-
10
-
11
-
12
-
13
-
14
-
15
-
16
-
17
-
18
-
19
-
20
-
21
-
22
-
23
-
24
-
25
-
26
-
27
-
28
-
29
-
30
-
31
-
32
-
33
-
34
-
35
-
36
-
37
-
38
-
39
-
40
-
41
-
42
-
43
-
44
-
45
-
46
-
47
-
48
-
49
-
50
-
51
-
52
-
53
-
54
-
55
-
56
-
57
-
58
-
59
-
60
-
61
-
62
-
63
-
64
-
65
-
66
-
67
-
68
-
69
-
70
-
71
-
72
-
73
-
74
-
75
-
76
-
77
-
78
-
79
-
80
-
81
-
82
-
83
-
84
-
85
-
86
-
87
-
88
-
89
-
90
-
91
-
92
-
93
-
94
-
95
-
96
-
97
-
98
-
99
-
100
-
101
-
102
-
103
-
104
-
105
-
106
-
107
-
108
-
109
-
110
-
111
-
112
-
113
-
114
-
115
-
116
-
117
-
118
-
119
-
 120
120 -
 121
121 -
 122
122 -
 123
123 -
 124
124 -
 125
125 -
 126
126 -
 127
127 -
 128
128 -
 129
129 -
 130
130 -
 131
131 -
 132
132 -
 133
133 -
 134
134 -
 135
135 -
 136
136 -
 137
137 -
 138
138 -
 139
139 -
 140
140 -
141
-
142
-
143
-
144
-
145
-
146
-
147
-
148
-
149
-
150
-
151
-
152
-
153
-
154
-
155
-
156
 |
 |

Notes to the Consolidated Financial Statements continued
128 |Financials
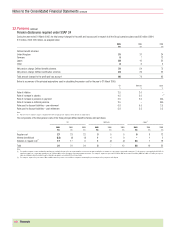
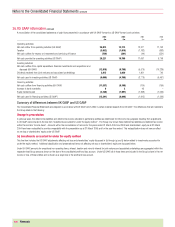
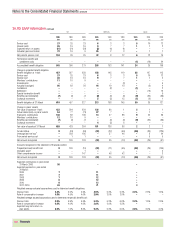
36.US GAAP information continued
The following tables reconcile Vodafone Italy’s turnover, loss for the financial year and equity shareholders’ funds from UK GAAP to their related amounts in US GAAP as used
in determining the net loss and shareholder’s equity in the Consolidated Financial Statements.
2005 2004 2003
£m £m £m
Turnover (UK GAAP) 5,521 5,276 4,371
Item increasing/(decreasing) revenue:
Connection revenue 109 4 (179)
Turnover (US GAAP) 5,630 5,280 4,192
Loss for the financial year (UK GAAP) (2,565) (2,381) (2,709)
Items (increasing)/decreasing net loss:
Goodwill and other intangible assets (2,885) (2,942) (2,702)
Income taxes 2,440 3,234 2,245
Other (2) (24) (8)
Net loss (US GAAP) (3,012) (2,113) (3,174)
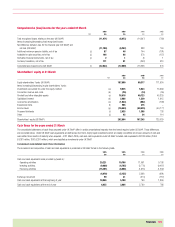
2005 2004
£m £m
Equity shareholders’ funds (UK GAAP) 17,280 20,855
Items increasing/(decreasing) equity shareholders’ funds:
Goodwill and other intangible assets 14,049 16,526
Income taxes (10,736) (12,812)
Other (54) (31)
Shareholders’ equity (US GAAP) 20,539 24,538
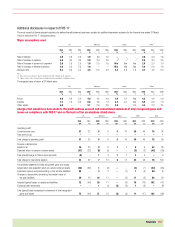
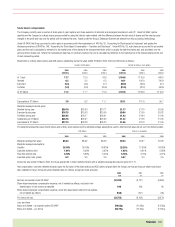
Vodafone Italy had the following effects on consolidated cash flows from operating, investing and financing activities presented in a US GAAP format:
2005 2004 2003
£m £m £m
Cash and cash equivalents were provided by/(used in):
Operating activities 2,272 2,588 1,846
Investing activities (769) (585) (724)
Financing activities –––
1,503 2,003 1,122
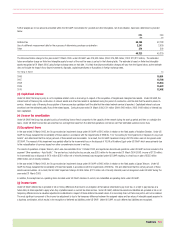
Equity in losses of investments accounted for under the equity method
2005 2004 2003
£m £m £m
Share of operating profit/(loss) in associated undertakings (UK GAAP) 1,193 546 (156)
Reclassification of exceptional non-operating items, interest, taxation and minority interests (789) (565) (614)
Share of Vodafone Italy’s loss for the financial year under UK GAAP (2,565) (2,381) (2,709)
US GAAP differences resulting in an effect on net income/(loss)(1) (18) 1,306 656
Equity in losses of investments accounted for under the equity method (US GAAP) (2,179) (1,094) (2,823)
Note:
(1) These differences represent the differences described in (b) through (g) and (j) below as they relate to investments accounted for under the equity method.
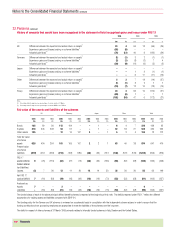
Carrying value of investments accounted for under the equity method
2005 2004
£m £m
Investments in associated undertakings (UK GAAP) 19,398 21,226
Carrying value of Vodafone Italy under UK GAAP 22,151 24,028
US GAAP differences affecting the carrying value of the investments(1) 5,043 15,669
Investments accounted for under the equity method (US GAAP) 46,592 60,923
Note:
(1) These differences represent the differences described in (b) through (g) and (j) below as they relate to investments accounted for under the equity method.