Vodafone 2005 Annual Report Download - page 53
Download and view the complete annual report
Please find page 53 of the 2005 Vodafone annual report below. You can navigate through the pages in the report by either clicking on the pages listed below, or by using the keyword search tool below to find specific information within the annual report.-
 1
1 -
2
-
3
-
4
-
5
-
6
-
7
-
8
-
9
-
10
-
11
-
12
-
13
-
14
-
15
-
16
-
17
-
18
-
19
-
20
-
21
-
22
-
23
-
24
-
25
-
26
-
27
-
28
-
29
-
30
-
31
-
32
-
33
-
34
-
35
-
36
-
37
-
38
-
39
-
40
-
41
-
42
-
 43
43 -
 44
44 -
 45
45 -
 46
46 -
 47
47 -
 48
48 -
 49
49 -
 50
50 -
 51
51 -
 52
52 -
 53
53 -
 54
54 -
 55
55 -
 56
56 -
 57
57 -
 58
58 -
 59
59 -
 60
60 -
 61
61 -
 62
62 -
 63
63 -
64
-
65
-
66
-
67
-
68
-
69
-
70
-
71
-
72
-
73
-
74
-
75
-
76
-
77
-
78
-
79
-
80
-
81
-
82
-
83
-
84
-
85
-
86
-
87
-
88
-
89
-
90
-
91
-
92
-
93
-
94
-
95
-
96
-
97
-
98
-
99
-
100
-
101
-
102
-
103
-
104
-
105
-
106
-
107
-
108
-
109
-
110
-
111
-
112
-
113
-
114
-
115
-
116
-
117
-
118
-
119
-
120
-
121
-
122
-
123
-
124
-
125
-
126
-
127
-
128
-
129
-
130
-
131
-
132
-
133
-
134
-
135
-
136
-
137
-
138
-
139
-
140
-
141
-
142
-
143
-
144
-
145
-
146
-
147
-
148
-
149
-
150
-
151
-
152
-
153
-
154
-
155
-
156
 |
 |

Performance |51
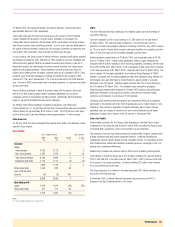
traffic moving from fixed networks to mobile networks. The most significant current
trends which are expected to impact the Group are:
Increasing penetration rates and competition between network
operators for customers
Customer growth is, and the Group expects it to continue to be, a principal source of
revenue growth. Gaining new customers depends on many factors, including network
coverage and quality, customer satisfaction, product offerings and handset range but a
key factor is often the pricing of handsets and tariffs. In general, as penetration rates
rise in a market, competition intensifies as operators invest more in retaining their
existing customers whilst offering incentives to potential new customers. These
competitive pressures, along with new mobile users who generally spend less than
existing users, exert a downward pressure on ARPU and result in increased acquisition
and retention costs. The Group anticipates that this trend will continue though it will
endeavour to offset the impact by usage stimulation campaigns, new product offerings
and leveraging the Group’s scale and scope.
A number of national regulators are considering allocating additional spectrum or
offering new licences for the provision of mobile telecommunications services. If the
additional spectrum or new licences are acquired by new or existing competitors, the
competitive pressures in the local market may increase.
Impact of new virtual competitors
New service providers in a number of markets in which the Group operates are
increasing the competitive pressures in certain market segments with low cost
offerings. Certain national regulators require, or have stated their intention to require,
network operators to provide network access to such service providers.
Downward pressure on termination rates from regulatory
action
In recent years, action by a number of national regulators has led to reductions in the
income the Group receives for terminating calls from fixed or other mobile networks
and, similarly, reductions in the cost charged by other operators for connecting a call
on their fixed or mobile network. Vodafone expects such regulatory pressure to persist
for the foreseeable future.
Development of and demand for non-voice services
Since the Group’s introduction of non-voice service offerings, turnover from these
services has increased each year, although there can be no assurance that this will
continue to be the case. With continued growth of messaging, more Vodafone live!
customers, the launch of 3G services, including video calling and full track music
downloads, the Vodafone Mobile Connect 3G/GPRS data card, and new business
focused offerings, the Group expects continued growth in non-voice service revenue and
for non-voice revenue to increase as a percentage of total service revenue over time.
Benefits of global scale and scope
As the world’s leading international mobile telecommunications company, the Group is
able to benefit from its global scale and scope. The One Vodafone initiatives (see
page 13) are targeted at maximising the future value of these benefits.
Impact of convergence and disruptive technologies
The emergence of new technologies, which enable core and radio access networks to
be increasingly based on Internet protocols, is likely to provide the Group with
opportunities to reduce costs and target the replacement of customers’ fixed line
phone services. However, they will also provide opportunities for new competitors to
enter the telecommunications services market. Vodafone believes it is well placed to
take advantage of these opportunities, as demonstrated by the launch of the Vodafone
at Home service in Germany.
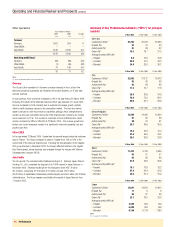
Depreciation expense
Depreciation expense is driven largely by capital expenditure on building and upgrading
the Group’s networks. Capital expenditure on network equipment has increased in recent
years with the construction of 3G networks. As network equipment has an expected
useful life of between three and ten years, the resulting depreciation expense is likely to
increase in the medium term. The One Vodafone initiatives are expected to reduce capital
expenditure, and hence depreciation, relative to turnover in the longer term.
Seasonality
The Group’s financial results and cash flows have not, historically, been subject to
significant seasonal trends between the first and second half of the financial year,
although there are a number of offsetting trends.
Traditionally, the Christmas period sees a higher volume of customer connections,
contributing to higher equipment and connection revenue in the second half of the
financial year. Ongoing airtime revenue also demonstrate signs of seasonality, with
revenue generally lower during February, which is a shorter than average month, and
revenue from roaming charges higher during the summer months as a result of
increased travel by customers.
There is no assurance that these trends will continue in the future. For additional
considerations related to these trends, please see “Risk Factors and Legal Proceedings
– Risk Factors”on pages 25 and 26.
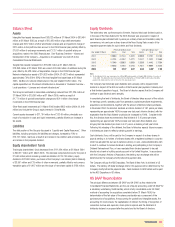
Outlook
For the year ending 31 March 2006(1)
These expectations for the 2006 financial year have been prepared on the basis of
IFRS and do not include the impact of the proposed acquisition of interests in MobiFon
in Romania and Oskar in the Czech Republic, which are subject to certain conditions.
Details of the Group’s principal differences between UK GAAP and IFRS are provided in
“Information on International Financial Reporting Standards”.
The Group expects growth in Group turnover in the 2006 financial year compared with
the 2005 financial year. Capitalised fixed asset additions(2) are anticipated to be similar
to the levels for the 2005 financial year at around £5 billion, as the Group continues
the roll out of its 3G networks.
Free cash flow is expected to be in the £6.5 billion to £7.0 billion range. This is
expected to be lower than that to be reported under IFRS for the 2005 financial year as
the benefit of higher operating cash flow is more than offset by:
•the expectation that dividends received from Verizon Wireless will be approximately
£0.7 billion lower; and
•higher expenditure on fixed assets and tax payments.
Share purchases are currently targeted to be approximately £4.5 billion in the 2006
financial year. Vodafone Italy shareholders are expected to approve the re-purchase of
€7.9 billion of shares in that company at a meeting on 26 May 2005.
The Group is not currently aware of any developments to IFRS and related
interpretations that would result in the reconciling items between UK GAAP and IFRS to
be reported for the years ending 31 March 2005 and 31 March 2006 being significantly
different to those previously reported for the six months ended 30 September 2004.
Other
The section entitled “Business Overview – Global Services – One Vodafone”on
page 13 provides additional outlook statements in relation to the expected future
benefits of One Vodafone initiatives on cash flow, capital expenditure and operating
expenditure.
(1) Comparisons to the 2005 financial year are prepared on the basis of IFRS, and where appropriate using constant exchange
rates and after adjusting for business acquisitions and disposals and items not reflecting underlying business performance.
(2) “Capitalised fixed asset additions”represents the aggregate of capitalised property, plant and equipment additions and
capitalised software costs.