Vodafone 2005 Annual Report Download - page 89
Download and view the complete annual report
Please find page 89 of the 2005 Vodafone annual report below. You can navigate through the pages in the report by either clicking on the pages listed below, or by using the keyword search tool below to find specific information within the annual report.-
 1
1 -
2
-
3
-
4
-
5
-
6
-
7
-
8
-
9
-
10
-
11
-
12
-
13
-
14
-
15
-
16
-
17
-
18
-
19
-
20
-
21
-
22
-
23
-
24
-
25
-
26
-
27
-
28
-
29
-
30
-
31
-
32
-
33
-
34
-
35
-
36
-
37
-
38
-
39
-
40
-
41
-
42
-
43
-
44
-
45
-
46
-
47
-
48
-
49
-
50
-
51
-
52
-
53
-
54
-
55
-
56
-
57
-
58
-
59
-
60
-
61
-
62
-
63
-
64
-
65
-
66
-
67
-
68
-
69
-
70
-
71
-
72
-
73
-
74
-
75
-
76
-
77
-
78
-
 79
79 -
 80
80 -
 81
81 -
 82
82 -
 83
83 -
 84
84 -
 85
85 -
 86
86 -
 87
87 -
 88
88 -
 89
89 -
 90
90 -
 91
91 -
 92
92 -
 93
93 -
 94
94 -
 95
95 -
 96
96 -
 97
97 -
 98
98 -
 99
99 -
100
-
101
-
102
-
103
-
104
-
105
-
106
-
107
-
108
-
109
-
110
-
111
-
112
-
113
-
114
-
115
-
116
-
117
-
118
-
119
-
120
-
121
-
122
-
123
-
124
-
125
-
126
-
127
-
128
-
129
-
130
-
131
-
132
-
133
-
134
-
135
-
136
-
137
-
138
-
139
-
140
-
141
-
142
-
143
-
144
-
145
-
146
-
147
-
148
-
149
-
150
-
151
-
152
-
153
-
154
-
155
-
156
 |
 |

Financials |87
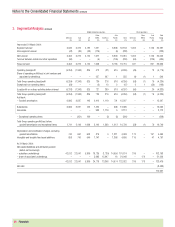
Mobile telecommunications Other operations
Other Asia Other Asia Total
Germany Italy UK EMEA Americas Pacific Total Germany EMEA Pacific Group
£m £m £m £m £m £m £m £m £m £m £m
Year ended 31 March 2003:
Segment turnover 4,754 4,397 4,055 6,219 18 8,596 28,039 924 – 2,616 31,579
Inter-segment turnover (32) (26) (29) (88) (13) (4) (192) –––(192)
Net turnover 4,722 4,371 4,026 6,131 5 8,592 27,847 924 – 2,616 31,387
Turnover between mobile and other operations (76) ––(1) –(228) (305) (70) – (637) (1,012)
Group turnover 4,646 4,371 4,026 6,130 5 8,364 27,542 854 – 1,979 30,375
Operating (loss)/profit (5,030) (1,955) 1,090 359 (117) 702 (4,951) (89) – (255) (5,295)
Share of operating (loss)/profit in joint ventures and
associated undertakings –––(13) (21) 2 (32) – (124) – (156)
Total Group operating (loss)/profit (5,030) (1,955) 1,090 346 (138) 704 (4,983) (89) (124) (255) (5,451)
Exceptional non-operating items –––(6) (28) (295) (329) 290 58 (24) (5)
(Loss)/profit on ordinary activities before interest (5,030) (1,955) 1,090 340 (166) 409 (5,312) 201 (66) (279) (5,456)
Total Group operating (loss)/profit (5,030) (1,955) 1,090 346 (138) 704 (4,983) (89) (124) (255) (5,451)
Add back:
– Goodwill amortisation 6,465 3,543 30 1,991 1,235 717 13,981 – 75 – 14,056
Subsidiaries 6,465 3,543 30 1,127 – 710 11,875 –––11,875
Associates –––864 1,235 7 2,106 – 75 – 2,181
– Exceptional operating items –––50 122 – 172 ––404 576
Total Group operating profit/(loss) before
goodwill amortisation and exceptional items 1,435 1,588 1,120 2,387 1,219 1,421 9,170 (89) (49) 149 9,181
Depreciation and amortisation charges, excluding
goodwill amortisation 565 570 417 720 15 1,190 3,477 166 – 389 4,032
Intangible and tangible fixed asset additions 800 732 500 1,188 9 1,393 4,622 135 – 186 4,943