Vodafone 2005 Annual Report Download - page 39
Download and view the complete annual report
Please find page 39 of the 2005 Vodafone annual report below. You can navigate through the pages in the report by either clicking on the pages listed below, or by using the keyword search tool below to find specific information within the annual report.-
 1
1 -
2
-
3
-
4
-
5
-
6
-
7
-
8
-
9
-
10
-
11
-
12
-
13
-
14
-
15
-
16
-
17
-
18
-
19
-
20
-
21
-
22
-
23
-
24
-
25
-
26
-
27
-
28
-
 29
29 -
 30
30 -
 31
31 -
 32
32 -
 33
33 -
 34
34 -
 35
35 -
 36
36 -
 37
37 -
 38
38 -
 39
39 -
 40
40 -
 41
41 -
 42
42 -
 43
43 -
 44
44 -
 45
45 -
 46
46 -
 47
47 -
 48
48 -
 49
49 -
50
-
51
-
52
-
53
-
54
-
55
-
56
-
57
-
58
-
59
-
60
-
61
-
62
-
63
-
64
-
65
-
66
-
67
-
68
-
69
-
70
-
71
-
72
-
73
-
74
-
75
-
76
-
77
-
78
-
79
-
80
-
81
-
82
-
83
-
84
-
85
-
86
-
87
-
88
-
89
-
90
-
91
-
92
-
93
-
94
-
95
-
96
-
97
-
98
-
99
-
100
-
101
-
102
-
103
-
104
-
105
-
106
-
107
-
108
-
109
-
110
-
111
-
112
-
113
-
114
-
115
-
116
-
117
-
118
-
119
-
120
-
121
-
122
-
123
-
124
-
125
-
126
-
127
-
128
-
129
-
130
-
131
-
132
-
133
-
134
-
135
-
136
-
137
-
138
-
139
-
140
-
141
-
142
-
143
-
144
-
145
-
146
-
147
-
148
-
149
-
150
-
151
-
152
-
153
-
154
-
155
-
156
 |
 |

Performance |37
The commencement of depreciation and amortisation on the 3G network and licence,
following launch of services in the second half of the previous financial year, reduced
operating profit before goodwill amortisation, with licence amortisation contributing the
largest share of this reduction. A higher proportion of prepaid additions, particularly in
the second half of the financial year, and lower contract subsidies led to net acquisition
costs decreasing by 3% in local currency in spite of an 8% increase in gross customer
additions. Lower loyalty scheme costs were offset by higher upgrade costs, particularly
in the second half of the financial year following increased activity through indirect
channels, and consequently net retention costs increased by 5%. Other operating
expenses and direct costs remained relatively stable compared to the prior year.
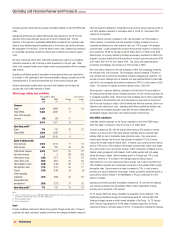
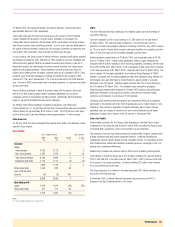
Italy
Years ended 31 March Local currency
2005 2004 Change change
£m £m % %
Turnover(1) 5,565 5,312 5 7
Trading Results
Voice services 4,548 4,380 4 6
Non-voice services 780 669 17 19
Total service revenue 5,328 5,049 6 7
Net other revenue(1) 19 13 46 38
Interconnect costs (913) (874) 4 6
Other direct costs(3) (302) (306) (1) –
Net acquisition costs(1) (93) (76) 22 23
Net retention costs(1) (97) (64) 52 55
Payroll (323) (301) 7 10
Other operating
expenses (659) (646) 2 4
Depreciation and
amortisation(2) (703) (652) 8 10
Operating profit(2)(3) 2,257 2,143 5 7
Notes:
(1) Turnover includes revenue of £218 million (2004: £250 million) which has been excluded from other revenue and deducted
from acquisition and retention costs in the trading results.
(2) Before goodwill amortisation
(3) Before exceptional items
Vodafone continues to perform robustly in Italy despite aggressive competition, through
strong market positioning driven by innovative promotions and a focus on high value
customers, through targeted retention initiatives. Notwithstanding market penetration
levels of over 100%, driven by the effect of customers having more than one SIM and
increased competition, Vodafone had good customer growth, with gross additions
higher than in the previous year and only a slight increase in churn to 17.2%.
Total turnover grew by 7%, when measured in local currency, reflecting the rise in
service revenue that was driven by an 8% increase in the average customer base.
ARPU remained stable despite a slight reduction in activity levels. Strong promotional
campaigns, such as fixed price phone calls for voice users or unlimited text messaging,
after paying for the first text message per day, in return for up front subscription fees,
significantly stimulated usage, with minutes of use increasing by 12% and the number
of text messages sent increasing by 11%.
Non-voice service revenue grew by 19% with revenue from non-messaging data
offerings increasing to £87 million, representing an 85% increase in local currency.
Vodafone live! active devices increased by 169% to 2,751,000 at 31 March 2005. In
the business segment Vodafone continued to increase its market share, with a 10%
growth in the customer base and continuing net inflow of customers through mobile
number portability. Strong revenue growth for this segment was supported by a higher
proportion of non-voice service revenue, partially driven by sales of Vodafone Mobile
Connect data cards.
Following the successful launch of consumer 3G services in November 2004,
customers had registered 665,000 3G devices on Vodafone’s network by the end of
the financial year.
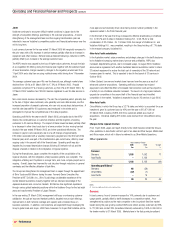
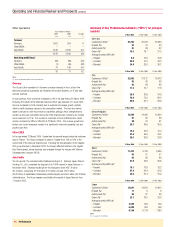
United Kingdom
Years ended 31 March
2005 2004 Change
£m £m %
Turnover(1) 5,065 4,782 6
Trading results
Voice services 3,672 3,522 4
Data services 826 674 23
Total service revenue 4,498 4,196 7
Net other revenue(1) 177 146 21
Interconnect costs (771) (752) 3
Other direct costs (367) (325) 13
Net acquisition costs (388) (333) 17
Net retention costs (391) (321) 22
Payroll(3) (389) (387) 1
Other operating
expenses(3) (657) (616) 7
Depreciation and
amortisation(2) (737) (510) 45
Operating profit(2)(3) 975 1,098 (11)
Notes:
(1) Turnover includes revenue of £390 million (2004: £440 million) which has been excluded from other revenue and deducted
from acquisition and retention costs in the trading results.
(2) Before goodwill amortisation.
(3) Before exceptional items.
In an intensively competitive market, Vodafone achieved growth in the customer base
and revenue whilst maintaining costs through the execution of a structured plan to
drive revenue and tighter control of operating expenses.
Turnover increased by 6%, comprising underlying growth of 1% and growth of 5%
attributable to the acquisition of a number of service providers in the prior year,
including Singlepoint. Service revenue rose by 7%, driven by an 8% increase in the
average customer base over the prior financial year. ARPU was broadly stable for the
financial year, with increases in non-voice service revenue and the impact of service
provider acquisitions being offset by termination rate cuts and reduced activity levels.
From 1 September 2004, Vodafone, along with other UK mobile network operators,
excluding the third generation operator, reduced termination rates by approximately
30% impacting service revenue in the second half of the financial year. The impact of
the termination rate cut was to reduce service revenue for the financial year by
3 percentage points.
Increased acquisition and retention activity and the success of new tariffs and services
especially those targeted at corporate and business segments, drove customer growth
in the financial year. Contract churn improved from 24.9% for the year ended 31
March 2004 to 22.7% for the year ended 31 March 2005, although blended churn of
29.7% was in line with the previous year. In addition, total customer activity levels fell
from 91% at 31 March 2004 to 89% at 31 March 2005, reflecting higher levels of
prepaid customer self upgrades, consistent with market trends. In the first half of the
financial year, an agreement was reached to provide wholesale services to BT and at
31 March 2005, 119,000 BT customers, reported as one registered customer, were
connected to the Vodafone network under this agreement.
Non-voice service revenue grew by 23%, with non-messaging data revenue increasing
by 81% to £142 million, mainly due to the success of service offerings such as
Vodafone live!, Vodafone Mobile Connect data cards and BlackBerry from Vodafone. At
31 March 2005, the number of Vodafone live! active devices rose to 3,443,000. In the