Vodafone 2005 Annual Report Download - page 75
Download and view the complete annual report
Please find page 75 of the 2005 Vodafone annual report below. You can navigate through the pages in the report by either clicking on the pages listed below, or by using the keyword search tool below to find specific information within the annual report.-
 1
1 -
2
-
3
-
4
-
5
-
6
-
7
-
8
-
9
-
10
-
11
-
12
-
13
-
14
-
15
-
16
-
17
-
18
-
19
-
20
-
21
-
22
-
23
-
24
-
25
-
26
-
27
-
28
-
29
-
30
-
31
-
32
-
33
-
34
-
35
-
36
-
37
-
38
-
39
-
40
-
41
-
42
-
43
-
44
-
45
-
46
-
47
-
48
-
49
-
50
-
51
-
52
-
53
-
54
-
55
-
56
-
57
-
58
-
59
-
60
-
61
-
62
-
63
-
64
-
 65
65 -
 66
66 -
 67
67 -
 68
68 -
 69
69 -
 70
70 -
 71
71 -
 72
72 -
 73
73 -
 74
74 -
 75
75 -
 76
76 -
 77
77 -
 78
78 -
 79
79 -
 80
80 -
 81
81 -
 82
82 -
 83
83 -
 84
84 -
 85
85 -
86
-
87
-
88
-
89
-
90
-
91
-
92
-
93
-
94
-
95
-
96
-
97
-
98
-
99
-
100
-
101
-
102
-
103
-
104
-
105
-
106
-
107
-
108
-
109
-
110
-
111
-
112
-
113
-
114
-
115
-
116
-
117
-
118
-
119
-
120
-
121
-
122
-
123
-
124
-
125
-
126
-
127
-
128
-
129
-
130
-
131
-
132
-
133
-
134
-
135
-
136
-
137
-
138
-
139
-
140
-
141
-
142
-
143
-
144
-
145
-
146
-
147
-
148
-
149
-
150
-
151
-
152
-
153
-
154
-
155
-
156
 |
 |

Governance |73
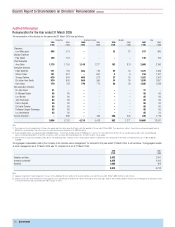
Further details of options outstanding at 31 March 2005 are as follows:
Exercisable Exercisable
Market price greater than Option price greater than
option price(1) market price(1) Not yet exercisable
Weighted Weighted
average Latest Weighted Latest average
Options exercise expiry Options average expiry Options exercise Earliest date
held price date held exercise price date held price from which
Number Pence Number Pence Number Pence exercisable
Arun Sarin(2) –––6,250,000 217.6 Jul-06 14,454,987 119.1 Jul-06
Peter Bamford –––3,725,712 201.4 Jul-11 15,347,310 137.1 Jul-05
Thomas Geitner –––3,259,679 209.3 Jul-11 14,075,175 141.3 Jul-05
Sir Julian Horn-Smith –––3,913,990 199.2 Jul-11 19,418,879 133.4 Jul-05
Ken Hydon –––3,323,012 210.1 Jul-11 15,394,154 137.0 Jul-05
20,472,393 78,690,505
Notes:
(1) Market price is the closing middle market price of the Company’s ordinary shares at 31 March 2005 of 140.50p.
(2) Some of Arun Sarin’s options are in respect of American Depositary Shares, each representing ten ordinary shares in the Company, which are traded on the New York Stock Exchange. The number and option price have been converted into the equivalent
amounts for the Company’s ordinary shares.
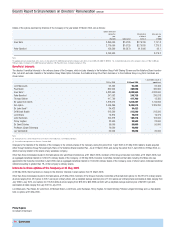
The Company’s register of directors’ interests (which is open to inspection at the Company’s registered office) contains full details of directors’ shareholdings and options to
subscribe. These options by exercise price were:
Options held at Options granted Options exercised Options lapsed
1 April 2004 during the during the during the
or date of 2005 financial 2005 financial 2005 financial Options held at
Opion price appointment year year year 31 March 2005
Pence Number Number Number Number Number
Vodafone Group Plc Executive Share Option Scheme (Approved – 1988) 58.70 150,500 – 150,500 – –
Vodafone Group Plc Share Option Scheme (Unapproved – 1988) 155.90 855,000 –––855,000
Vodafone Group 1998 Company Share Option Scheme (Approved) 255.00 377,000 –––377,000
Vodafone Group 1998 Executive Share Option Scheme (Unapproved) 282.30 1,064,100 –––1,064,100
Vodafone Group Plc Savings Related Share Option Scheme (1988) 70.92 50,126 –––50,126
Vodafone Group 1998 Sharesave Scheme 95.30 16,710 –––16,710
AirTouch Communications, Inc. 1993 Long Term Incentive Plan(1) 95.12 5,000,000 – 5,000,000 – –
Vodafone Group Plc 1999 Long Term Stock Incentive Plan 97.00 20,846,662 ––2,911,465 17,935,197
119.00 – 20,567,824 ––20,567,824
119.25 25,637,680 ––2,751,202 22,886,478
151.56 1,848,000 –––1,848,000
157.50 16,943,043 –––16,943,043
164.49 100,146 ––100,146 –
242.43 6,250,000 –––6,250,000
291.50 10,369,420 –––10,369,420
89,508,387 20,567,824 5,150,500 5,762,813 99,162,898
Notes:
(1) These share options are in respect of American Depositary Shares, each representing ten ordinary shares in the Company, which are traded on the New York Stock Exchange. The number and option price have been converted into the equivalent amounts
for the Company’s ordinary shares.