Vodafone 2005 Annual Report Download - page 35
Download and view the complete annual report
Please find page 35 of the 2005 Vodafone annual report below. You can navigate through the pages in the report by either clicking on the pages listed below, or by using the keyword search tool below to find specific information within the annual report.-
 1
1 -
2
-
3
-
4
-
5
-
6
-
7
-
8
-
9
-
10
-
11
-
12
-
13
-
14
-
15
-
16
-
17
-
18
-
19
-
20
-
21
-
22
-
23
-
24
-
 25
25 -
 26
26 -
 27
27 -
 28
28 -
 29
29 -
 30
30 -
 31
31 -
 32
32 -
 33
33 -
 34
34 -
 35
35 -
 36
36 -
 37
37 -
 38
38 -
 39
39 -
 40
40 -
 41
41 -
 42
42 -
 43
43 -
 44
44 -
 45
45 -
46
-
47
-
48
-
49
-
50
-
51
-
52
-
53
-
54
-
55
-
56
-
57
-
58
-
59
-
60
-
61
-
62
-
63
-
64
-
65
-
66
-
67
-
68
-
69
-
70
-
71
-
72
-
73
-
74
-
75
-
76
-
77
-
78
-
79
-
80
-
81
-
82
-
83
-
84
-
85
-
86
-
87
-
88
-
89
-
90
-
91
-
92
-
93
-
94
-
95
-
96
-
97
-
98
-
99
-
100
-
101
-
102
-
103
-
104
-
105
-
106
-
107
-
108
-
109
-
110
-
111
-
112
-
113
-
114
-
115
-
116
-
117
-
118
-
119
-
120
-
121
-
122
-
123
-
124
-
125
-
126
-
127
-
128
-
129
-
130
-
131
-
132
-
133
-
134
-
135
-
136
-
137
-
138
-
139
-
140
-
141
-
142
-
143
-
144
-
145
-
146
-
147
-
148
-
149
-
150
-
151
-
152
-
153
-
154
-
155
-
156
 |
 |

Performance |33
2005 financial year compared to 2004 financial year
Turnover increased by 2% to £34,133 million in the year ended 31 March 2005,
comprising organic growth of 6%, offset by unfavourable movements in exchange rates
of 2% and the effect of acquisitions and disposals, principally the disposal of Japan
Telecom, of 2%. The foreign exchange impact primarily arose due to the relative
strength of sterling in the first half of the financial year compared to the prior period,
partially offset by a relative weakening in the second half.
After goodwill amortisation and exceptional items, the Group reported a total operating
loss of £4,111 million, compared with a loss of £4,230 million for the prior year. The
charges for goodwill amortisation, which do not affect the cash flows of the Group or
the ability of the Company to pay dividends, fell by 3% to £14,700 million, principally
as a result of the impact of foreign exchange movements. Following the Group’s
transition to IFRS in the 2006 financial year, no goodwill amortisation charges will be
incurred. The exceptional operating items moved from a £228 million net credit in the
prior financial year, due principally to expected recoveries and provision releases in
relation to a contribution tax levy on Vodafone Italy, to a £315 million charge in the
2005 financial year due to an impairment of the carrying value of the goodwill relating
to Vodafone Sweden.
Before goodwill amortisation and exceptional items, total Group operating profit
increased by 1% to £10,904 million, with organic growth of 5%, broadly in line with
the growth in turnover. Unfavourable exchange rate movements represented 3% of the
difference between reported and organic growth, whilst acquisitions and disposals
reduced reported growth by a further 1%.
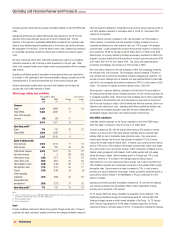
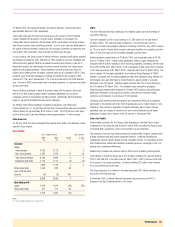
Operating Results
Group overview
The Group has amended its segmental disclosure of turnover to a gross of intercompany turnover basis, rather than a net of intercompany turnover basis as previously disclosed, in
order to facilitate analysis of the performance of the Group and as part of the Group’s preparations for the introduction of IFRS. There is no impact on total Group turnover, which
continues to be stated on a net of intercompany turnover basis. In addition, a more detailed analysis of the results of the Group’s mobile telecommunications (“mobile”) business
and certain key markets has been provided, on a basis consistent with internal measures, to facilitate management’s discussion of the results.
Years ended 31 March
2005 2004 2003
£m £m £m
Turnover
Mobile telecommunications 33,184 31,915 27,847
Other operations 1,108 2,128 3,540
Less: turnover between mobile and other operations (159) (484) (1,012)
34,133 33,559 30,375
Total Group operating loss (4,111) (4,230) (5,451)
Mobile telecommunications(1) 10,875 10,729 9,170
Other operations(1) 29 20 11
10,904 10,749 9,181
Goodwill amortisation (14,700) (15,207) (14,056)
Exceptional operating items (315) 228 (576)
Exceptional non-operating items 13 (103) (5)
Net interest expense (604) (714) (752)
Taxation (2,236) (3,154) (2,956)
Loss on ordinary activities after taxation (6,938) (8,201) (9,164)
Loss for the financial year (7,540) (9,015) (9,819)
Notes:
(1) before goodwill amortisation and exceptional operating items
Mobile telecommunications
Years ended 31 March
2005 2004 Change
£m £m %
Total service revenue 29,322 28,249 4
Other revenue(1) 3,862 3,666 5
33,184 31,915 4
Trading results:
Voice services 24,349 23,708 3
Non-voice services 4,973 4,541 10
Total service revenue 29,322 28,249 4
Net other revenue(1) 557 512 9
Interconnect costs (4,311) (4,137) 4
Other direct costs (1,975) (2,004) (1)
Net acquisition costs(1) (2,051) (1,897) 8
Net retention costs(1) (1,914) (1,638) 17
Payroll(2) (2,091) (2,016) 4
Other operating expenses(2) (4,693) (4,802) (2)
Depreciation and amortisation(3) (4,971) (4,197) 18
Share of operating profit in
associated undertakings 3,002 2,659 13
Total Group operating profit(2)(3) 10,875 10,729 1
Notes:
(1) Turnover for the mobile telecommunications business includes revenue of £3,305 million (2004: £3,154 million) which has
been deducted from acquisition and retention costs and excluded from other revenue in the trading results
(2) Before exceptional items
(3) Before goodwill amortisation