Vodafone 2005 Annual Report Download - page 36
Download and view the complete annual report
Please find page 36 of the 2005 Vodafone annual report below. You can navigate through the pages in the report by either clicking on the pages listed below, or by using the keyword search tool below to find specific information within the annual report.-
 1
1 -
2
-
3
-
4
-
5
-
6
-
7
-
8
-
9
-
10
-
11
-
12
-
13
-
14
-
15
-
16
-
17
-
18
-
19
-
20
-
21
-
22
-
23
-
24
-
25
-
 26
26 -
 27
27 -
 28
28 -
 29
29 -
 30
30 -
 31
31 -
 32
32 -
 33
33 -
 34
34 -
 35
35 -
 36
36 -
 37
37 -
 38
38 -
 39
39 -
 40
40 -
 41
41 -
 42
42 -
 43
43 -
 44
44 -
 45
45 -
 46
46 -
47
-
48
-
49
-
50
-
51
-
52
-
53
-
54
-
55
-
56
-
57
-
58
-
59
-
60
-
61
-
62
-
63
-
64
-
65
-
66
-
67
-
68
-
69
-
70
-
71
-
72
-
73
-
74
-
75
-
76
-
77
-
78
-
79
-
80
-
81
-
82
-
83
-
84
-
85
-
86
-
87
-
88
-
89
-
90
-
91
-
92
-
93
-
94
-
95
-
96
-
97
-
98
-
99
-
100
-
101
-
102
-
103
-
104
-
105
-
106
-
107
-
108
-
109
-
110
-
111
-
112
-
113
-
114
-
115
-
116
-
117
-
118
-
119
-
120
-
121
-
122
-
123
-
124
-
125
-
126
-
127
-
128
-
129
-
130
-
131
-
132
-
133
-
134
-
135
-
136
-
137
-
138
-
139
-
140
-
141
-
142
-
143
-
144
-
145
-
146
-
147
-
148
-
149
-
150
-
151
-
152
-
153
-
154
-
155
-
156
 |
 |

Operating and Financial Review and Prospects continued
34 |Performance
Turnover
Turnover in the mobile business increased by 4%, or 5% on an organic basis, for the
year ended 31 March 2005. The increase in turnover was driven principally by organic
service revenue growth, at constant exchange rates, of 5%, which improved principally
as a result of a 9% increase in the Group’s average controlled customer base and 10%
growth in total voice usage compared to the prior year, offset by the effect of regulatory
and competitive pressures on pricing and the increase in the proportion of prepaid
customers across the Group.
Voice revenue improved by 4% on an organic basis, following an increase in voice
usage, partially offset by tariff reductions due to increased competition and lower
termination rates.
Non-voice service revenue increased to £4,973 million for the year ended 31 March
2005, or by 11% on an organic basis. Messaging revenue continued to represent the
largest component of non-voice revenue at £3,589 million for the financial year, a 7%
increase over the previous financial year. Non-messaging data revenue increased by
17% to £1,384 million as the Group continued to drive adoption of consumer services,
such as Vodafone live! and Vodafone live! with 3G, and business offerings, including the
Vodafone Mobile Connect data card and BlackBerry from Vodafone. Japan generates
the highest level of non-messaging data revenue in the Group and, following the loss of
higher value customers and an increased proportion of prepaid customers with access
to only basic data services, its non-messaging data revenue reduced by 7% to
£816 million in the 2005 financial year.
Other revenue increased to £3,862 million, principally due to growth in revenue related
to acquisition and retention activities to £3,305 million, being 7% on an organic basis.
The increase has arisen principally from higher levels of gross additions and upgrades
in the year, partially offset by a reduction in the average handset sales price.
Total Group operating profit before goodwill amortisation and exceptional
items
Total Group operating profit, before goodwill amortisation and exceptional items,
increased by 1% to £10,875 million, comprising organic growth of 4% offset by
unfavourable exchange rate movements, particularly the strengthening of sterling
against the euro and the US dollar.
Acquisition and retention costs, net of attributable revenue, increased by 12% to
£3,965 million. The increase was primarily driven by higher customer growth in the UK
and Spain and increased investment in retention activities in the UK and Japan. Other
operating expenses as a percentage of service revenue reduced from 17.0% to 16.0%
as the Group continued to realise cost efficiencies, particularly in network and IT costs.
Depreciation and licence amortisation charges increased by 18% following the
commencement of 3G services in a number of the Group’s controlled mobile
businesses. Licence amortisation amounted to £412 million in the year compared to
£98 million in the prior year.
The Group’s share of operating profit, before goodwill amortisation and exceptional
items, in associated undertakings grew strongly, primarily due to growth at Verizon
Wireless in the US.
Non-mobile telecommunications
Turnover from other operations decreased by 48% to £1,108 million in the year ended
31 March 2005, principally as a result of the deconsolidation of Japan Telecom from
1 October 2003. Group operating profit, before goodwill amortisation and exceptional
items, increased by 45% to £29 million, principally as a result of operational
efficiencies in Arcor.
Exceptional operating items
The exceptional operating cost of £315 million in the year ended 31 March 2005 is
due to an impairment charge in relation to the carrying value of goodwill of Vodafone
Sweden. The impairment results from recent fierce price competition in the Swedish
market combined with onerous 3G licence obligations. Net exceptional operating
income for the previous financial year of £228 million comprised £351 million of
expected recoveries and provision releases in relation to a contribution tax levy on
Vodafone Italy, net of £123 million of restructuring costs, principally in the UK.
In accordance with accounting standards the Group regularly monitors the carrying
value of its fixed assets. A review was undertaken as at 31 March 2005 to assess
whether the carrying value of assets was supported by the net present value of future
cash flows derived from assets using cash flow projections for each asset in respect of
the period to 31 March 2015. The results of the review undertaken as at 31 March
2005 indicated that an impairment charge of £315 million was necessary in respect of
goodwill held in relation to Vodafone Sweden.
Exceptional non-operating items
The net exceptional non-operating credit for the year ended 31 March 2005 of
£13 million (2004: charge of £103 million) principally relates to profits on disposal of
fixed asset investments. The prior year charge principally related to a loss on disposal
of the Japan Telecom fixed line operations.
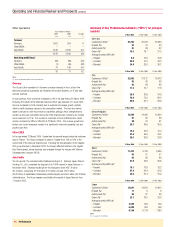
Net interest payable
Years ended 31 March
2005 2004 Change
£m £m %
Group net interest payable 151 310 (51)
Dividends from investments (19) (26) (27)
Potential interest charges arising on
settlement of outstanding tax issues 261 215 21
Group net interest payable 393 499 (21)
Share of associated undertakings 211 215 (2)
Total Group net interest payable 604 714 (15)
Group net interest payable before dividends from investments has fallen by 51% to
£151 million, primarily reflecting a reduction in average net debt. Group net interest
payable was covered 37 times by operating cash flow plus dividends received from
associated undertakings.
Taxation
The effective rate of taxation for the year ended 31 March 2005 is (47.6)% compared
to (62.5)% for the year ended 31 March 2004. This rate includes the impact of
goodwill amortisation and exceptional items, which may not be taxable or deductible for
tax purposes. Aside from non-tax deductible goodwill, which results in a negative
effective tax rate, the Group’s tax charge has benefited from the finalisation of the
reorganisation of the Group’s German operations in the current period, which has
outweighed the impact of reduced tax incentives in Italy and the absence of last year’s
one-off benefit from the restructuring of the Group’s associated undertakings in France.
The Group’s tax charge has also benefited from exceptional current and deferred tax
credits of £599 million, which relate to tax losses in Vodafone Holdings K.K. becoming
eligible for offset against the profits of Vodafone K.K. following the merger of the two
entities on 1 October 2004. The tax credit was recognised following shareholder and
regulatory approval of the transaction in the period.
Please refer to note 8 to the Consolidated Financial Statements for a discussion of
factors affecting the tax charge in future years.
Basic loss per share
Basic loss per share, after goodwill amortisation and exceptional items, improved from a
loss per share of 13.24 pence to a loss per share of 11.39 pence for the year ended
31 March 2005. The loss per share includes a charge of 22.21 pence per share (2004:
22.33 pence per share) in relation to the amortisation of goodwill and a credit of 0.41
pence per share (2004: charge of 0.01 pence per share) in relation to exceptional items.