Vodafone 2005 Annual Report Download - page 46
Download and view the complete annual report
Please find page 46 of the 2005 Vodafone annual report below. You can navigate through the pages in the report by either clicking on the pages listed below, or by using the keyword search tool below to find specific information within the annual report.
Operating and Financial Review and Prospects continued
44 |Performance
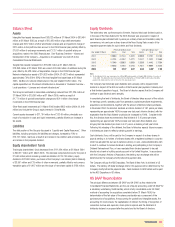
Other operations
Years ended 31 March
2004 2003 Change
£m £m %
Turnover
Germany 1,002 924 8
Other EMEA –––
Asia Pacific 1,126 2,616 (57)
2,128 3,540 (40)
Operating profit/(loss)(1)
Germany (58) (89) (35)
Other EMEA (1) (49) (98)
Asia Pacific 79 149 (47)
20 11 82
Notes:
(1) before goodwill amortisation and exceptional items
Germany
The Group’s other operations in Germany comprise interests in Arcor, a fixed line
telecommunications businesses, and Vodafone Information Systems, an IT and data
services business.
In local currency, Arcor’s turnover increased by 4% in the year ended 31 March 2004.
Excluding the results of the Telematik business which was disposed of in June 2002,
turnover increased by 16%, primarily due to customer and usage growth, partially
offset by tariff decreases caused by the competitive market. The fixed line market
leader continued to drive this intensive competition, although Arcor strengthened its
position as the main competitor during the 2004 financial year, increasing its contract
voice customers by 11%. The number of customers of Arcor’s ISDN service, Direct
Access, increased by 98% to 389,000 at 31 March 2004. This revenue growth and
further cost control measures resulted in a significantly improved operating loss and
positive cash flow.
Other EMEA
In the year ended 31 March 2004, Cegetel had the second largest residential customer
base in France. The Group increased its stake in Cegetel from 15% to 30% in the
second half of the previous financial year. Following the reorganisation of the Cegetel-
SFR group structure in December 2003, the Group’s effective interest in the Cegetel
fixed line business, whose business was enlarged through the merger with Télécom
Développement, became 28.5%.
Asia Pacific
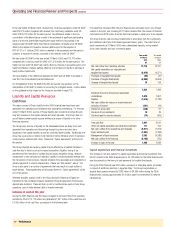
The Group’s 66.7% controlled entity Vodafone Holdings K.K. (formerly Japan Telecom
Holdings Co., Ltd.) completed the disposal of its 100% interest in Japan Telecom in
November 2003. Receipts resulting from this transaction were ¥257.9 billion
(£1.4 billion), comprising ¥178.9 billion (£1.0 billion) of cash, ¥32.5 billion
(£0.2 billion) of transferable redeemable preferred equity and ¥46.5 billion (£0.2 billion)
withholding tax. The Group ceased consolidating the results of Japan Telecom from
1 October 2003.
Summary of Key Performance Indicators (“KPIs”) for principal
markets
31 Mar 2005 31 Mar 2004 31 Mar 2003
Germany
Customers (’000s)(1) 27,223 25,012 22,940
Prepaid (%) 52 51 53
Activity level (%)(1) 91 93 92
Churn (%)(1) 18.3 18.7 21.2
Average monthly ARPU (€)(1)
– Prepaid 9.8 10.8 10.8
– Contract 39.9 41.2 43.3
– Blended 24.9 25.9 36.1
31 Mar 2005 31 Mar 2004 31 Mar 2003
Italy
Customers (’000s)(1) 22,502 21,137 19,412
Prepaid (%) 92 92 92
Activity level (%)(1) 92 93 95
Churn (%)(1) 17.2 16.7 17.3
Average monthly ARPU (€)(1)
– Prepaid 25.4 25.8 24.8
– Contract 76.8 75.0 68.2
– Blended 29.9 30.1 28.9
31 Mar 2005 31 Mar 2004 31 Mar 2003
United Kingdom
Customers (’000s)(1) 15,324 14,095 13,300
Prepaid (%) 61 60 59
Activity level (%)(1) 89 91 91
Churn (%)(1) 29.7 29.6 30.0
Average monthly ARPU (£)(1)
– Prepaid 10.3 10.8 10.4
– Contract 47.4 45.9 43.2
– Blended 25.5 25.8 23.8
31 Mar 2005 31 Mar 2004 31 Mar 2003
Spain
Customers (’000s)(1) 11,472 9,705 9,096
Prepaid (%) 53 57 57
Activity level (%)(1) 93 96 96
Churn (%)(1) 21.9 23.6 26.8
Average monthly ARPU (€)(1)
– Prepaid 15.1 13.8 13.2
– Contract 57.4 54.4 52.6
– Blended 34.5 31.4 31.0
31 Mar 2005 31 Mar 2004 31 Mar 2003
Japan
Customers (’000s)(1) 15,041 14,951 13,912
Prepaid (%) 11 96
Activity level (%)(1) 96 97 98
Churn (%)(1) 22.7 23.0 23.3
Average monthly ARPU (¥)
– Prepaid 2,548 N/A N/A
– Contract 6,520 N/A N/A
– Blended 6,148 6,724 7,263
Notes:
(1) See page 28 for definitions.


