Vodafone 2005 Annual Report Download - page 87
Download and view the complete annual report
Please find page 87 of the 2005 Vodafone annual report below. You can navigate through the pages in the report by either clicking on the pages listed below, or by using the keyword search tool below to find specific information within the annual report.-
 1
1 -
2
-
3
-
4
-
5
-
6
-
7
-
8
-
9
-
10
-
11
-
12
-
13
-
14
-
15
-
16
-
17
-
18
-
19
-
20
-
21
-
22
-
23
-
24
-
25
-
26
-
27
-
28
-
29
-
30
-
31
-
32
-
33
-
34
-
35
-
36
-
37
-
38
-
39
-
40
-
41
-
42
-
43
-
44
-
45
-
46
-
47
-
48
-
49
-
50
-
51
-
52
-
53
-
54
-
55
-
56
-
57
-
58
-
59
-
60
-
61
-
62
-
63
-
64
-
65
-
66
-
67
-
68
-
69
-
70
-
71
-
72
-
73
-
74
-
75
-
76
-
 77
77 -
 78
78 -
 79
79 -
 80
80 -
 81
81 -
 82
82 -
 83
83 -
 84
84 -
 85
85 -
 86
86 -
 87
87 -
 88
88 -
 89
89 -
 90
90 -
 91
91 -
 92
92 -
 93
93 -
 94
94 -
 95
95 -
 96
96 -
 97
97 -
98
-
99
-
100
-
101
-
102
-
103
-
104
-
105
-
106
-
107
-
108
-
109
-
110
-
111
-
112
-
113
-
114
-
115
-
116
-
117
-
118
-
119
-
120
-
121
-
122
-
123
-
124
-
125
-
126
-
127
-
128
-
129
-
130
-
131
-
132
-
133
-
134
-
135
-
136
-
137
-
138
-
139
-
140
-
141
-
142
-
143
-
144
-
145
-
146
-
147
-
148
-
149
-
150
-
151
-
152
-
153
-
154
-
155
-
156
 |
 |

Financials |85
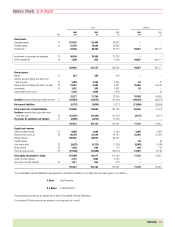
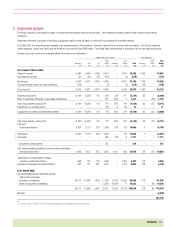
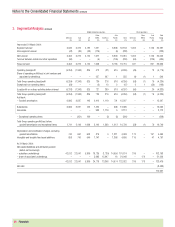
3. Segmental analysis
The Group’s business is principally the supply of mobile telecommunications services and products. Other operations primarily comprise fixed line telecommunications
businesses.
Segmental information is provided on the basis of geographic regions, being the basis on which the Group manages its worldwide interests.
In October 2004, the Group announced changes in the regional structure of its operations. Germany, Italy and the UK now form their own regions. The Group’s remaining
mobile operations, outside Asia Pacific and the Americas, now form the Other EMEA region. The results below are presented in accordance with the new regional structure.
Turnover is by origin, which is not materially different from turnover by destination.
Mobile telecommunications Other operations
Other Asia Other Total
Germany Italy UK EMEA Americas Pacific Total Germany EMEA Group
£m £m £m £m £m £m £m £m £m £m
Year ended 31 March 2005:
Segment turnover 5,684 5,565 5,065 8,614 – 8,531 33,459 1,108 – 34,567
Inter-segment turnover (51) (44) (47) (129) –(4) (275) ––(275)
Net turnover 5,633 5,521 5,018 8,485 – 8,527 33,184 1,108 – 34,292
Turnover between mobile and other operations (110) ––(3) –(1) (114) (45) –(159)
Group turnover 5,523 5,521 5,018 8,482 – 8,526 33,070 1,063 – 34,133
Operating (loss)/profit (5,161) (1,522) 745 382 (31) 217 (5,370) 65 1 (5,304)
Share of operating profit/(loss) in associated undertakings –––337 890 4 1,231 –(38) 1,193
Total Group operating (loss)/profit (5,161) (1,522) 745 719 859 221 (4,139) 65 (37) (4,111)
Exceptional non-operating items –––(10) 3 20 13 ––13
(Loss)/profit on ordinary activities before interest (5,161) (1,522) 745 709 862 241 (4,126) 65 (37) (4,098)
Total Group operating (loss)/profit (5,161) (1,522) 745 719 859 221 (4,139) 65 (37) (4,111)
Add back:
– Goodwill amortisation 6,824 3,779 230 2,349 788 729 14,699 1 – 14,700
Subsidiaries 6,824 3,779 230 1,369 – 726 12,928 1 – 12,929
Associates –––980 788 3 1,771 ––1,771
– Exceptional operating items –––315 ––315 ––315
Total Group operating profit/(loss) before goodwill amortisation
and exceptional items(1) 1,663 2,257 975 3,383 1,647 950 10,875 66 (37) 10,904
Depreciation and amortisation charges,
excluding goodwill amortisation 948 700 733 1,086 – 1,300 4,767 173 – 4,940
Intangible and tangible fixed asset additions 842 721 801 1,548 – 1,150 5,062 128 – 5,190
At 31 March 2005:
Net assets/(liabilities) and attributed goodwill
(before net borrowings):
– subsidiary undertakings 36,674 19,066 4,603 17,058 (2,001) 15,098 90,498 578 – 91,076
– share of associated undertakings –––5,029 14,286 17 19,332 – 66 19,398
36,674 19,066 4,603 22,087 12,285 15,115 109,830 578 66 110,474
Net debt (8,339)
102,135
Note:
(1) The Group considers its segment result to be Total Group operating profit before goodwill amortisation and exceptional items.