Vodafone 2005 Annual Report Download - page 45
Download and view the complete annual report
Please find page 45 of the 2005 Vodafone annual report below. You can navigate through the pages in the report by either clicking on the pages listed below, or by using the keyword search tool below to find specific information within the annual report.-
 1
1 -
2
-
3
-
4
-
5
-
6
-
7
-
8
-
9
-
10
-
11
-
12
-
13
-
14
-
15
-
16
-
17
-
18
-
19
-
20
-
21
-
22
-
23
-
24
-
25
-
26
-
27
-
28
-
29
-
30
-
31
-
32
-
33
-
34
-
 35
35 -
 36
36 -
 37
37 -
 38
38 -
 39
39 -
 40
40 -
 41
41 -
 42
42 -
 43
43 -
 44
44 -
 45
45 -
 46
46 -
 47
47 -
 48
48 -
 49
49 -
 50
50 -
 51
51 -
 52
52 -
 53
53 -
 54
54 -
 55
55 -
56
-
57
-
58
-
59
-
60
-
61
-
62
-
63
-
64
-
65
-
66
-
67
-
68
-
69
-
70
-
71
-
72
-
73
-
74
-
75
-
76
-
77
-
78
-
79
-
80
-
81
-
82
-
83
-
84
-
85
-
86
-
87
-
88
-
89
-
90
-
91
-
92
-
93
-
94
-
95
-
96
-
97
-
98
-
99
-
100
-
101
-
102
-
103
-
104
-
105
-
106
-
107
-
108
-
109
-
110
-
111
-
112
-
113
-
114
-
115
-
116
-
117
-
118
-
119
-
120
-
121
-
122
-
123
-
124
-
125
-
126
-
127
-
128
-
129
-
130
-
131
-
132
-
133
-
134
-
135
-
136
-
137
-
138
-
139
-
140
-
141
-
142
-
143
-
144
-
145
-
146
-
147
-
148
-
149
-
150
-
151
-
152
-
153
-
154
-
155
-
156
 |
 |

Performance |43
31 March 2004, US market penetration and Verizon Wireless’ market share were
approximately 56% and 24%, respectively.
Churn rates continued to improve and were among the lowest in the US wireless
industry despite the introduction of local number portability in the largest 100
metropolitan service areas from 24 November 2003, which allows customers to keep
their phone numbers when switching providers. The low churn rate was attributable to
the quality of Verizon Wireless’ network and the success of retention programmes such
as the Worry Free Guarantee, which includes the New Every Two plan.
In local currency, the Group’s share of Verizon Wireless’ operating profit before goodwill
amortisation increased by 20%, reflecting an 18% increase in turnover, increased cost
efficiencies being partially offset by increased acquisition and retention costs net of
equipment revenue, as a percentage of service revenue resulting from higher gross
additions and upgrade activities. Verizon Wireless’ turnover growth was driven by
higher service revenue from the larger customer base and an increase in ARPU. Data
products, such as picture messaging, positively contributed to an increase in data
revenue of 172%, which represented 2.7% of service revenue for the 2004 financial
year. The rise in ARPU was primarily due to a higher proportion of customers on higher
access price plans.
Verizon Wireless continued to expand its product base, with the launch during the
period of the first graphics based instant messaging application and a picture
messaging service to complement its data products. Additionally, Verizon Wireless
began to expand its BroadbandAccess service nationally.
On 23 May 2003, Verizon Wireless completed a transaction with Northcoast
Communications L.L.C., to purchase 50 Personal Communications licences and related
network assets for approximately $762 million in cash. The PCS licences cover large
portions of the East Coast and Midwest, serving approximately 47 million people.
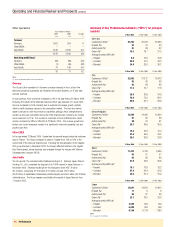
Other Americas
On 29 July 2003, the Group completed the disposal of its stake in the Mexican mobile
operator Grupo Iusacell.
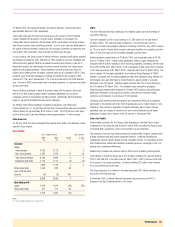
Asia Pacific
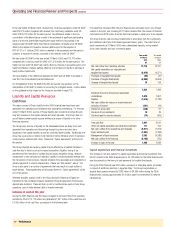
Years ended 31 March Local currency
2004 2003 Change change
£m £m % %
Turnover
Japan:
Voice services 4,790 4,776 – 2
Non-voice services 1,350 1,216 11 12
Total service revenue 6,140 5,992 2 4
Equipment and other 1,710 1,774 (4) (3)
7,850 7,766 1 2
Other Asia Pacific 1,052 833 26
Less: intra-segment
turnover (6) (3) 100
8,896 8,596 3
Operating profit(1)
Japan 1,045 1,310 (20) (20)
Other Asia Pacific 167 111 50
1,212 1,421 (15)
Notes:
(1) before goodwill amortisation and exceptional items
Japan
The 2004 financial year was challenging for Vodafone Japan due to the strength of
competitor offerings.
Turnover increased by 2% in local currency to £7,850 million for the year ended
31 March 2004. The customer base increased by 7% over that year, with the
proportion of lower value prepaid customers increasing to 9% from 6%. ARPU reduced
by 7%, as a result of higher value contract customers migrating to competitors and the
effect of new price plans and the increased prepaid customer base.
Vodafone Japan’s market share, at 31 March 2004, was marginally lower, at 18.4%,
than at 31 March 2003. Overall mobile penetration levels in Japan remained low
compared with the other markets in which the Group operates, increasing over the year
from 64% to 68% at 31 March 2004. 20% of Japanese mobile users were connected
to 3G network services at 31 March 2004, compared with 9% at 31 March 2003. The
lack of suitable 3G handsets available for the Vodafone Global Standard W-CDMA
network, compared with the range available through other operators using different 3G
technologies, amongst other factors, limited Vodafone Japan’s ability to compete
effectively in the 3G market. Vodafone Japan held less than 1% of the customers in
the 3G market at 31 March 2004. To counteract these competitive pressures,
Vodafone Japan implemented measures in October 2003 including new price plans,
additional investment in the upgrade of existing customers and improved loyalty
schemes, and introduced a new range of 2.5G handsets.
Operating profit before goodwill amortisation and exceptional items fell as expected,
particularly in the second half of the 2004 financial year, due to higher retention costs
reflecting a high volume of upgrades, increased marketing spend, higher network
operating costs, an increase in provisions for slow moving handsets and a higher
depreciation charge due to launch of the 3G network in December 2002.
Other Asia Pacific
Proportionate customers for the Group’s other operations in the Asia Pacific region
increased by 14% during the year ended 31 March 2004, including the Group’s share
of China Mobile’s customers, which is accounted for as an investment.
The increase in turnover was driven primarily by Vodafone New Zealand, resulting from
a larger customer base and higher equipment revenue. Vodafone Australia also
experienced turnover growth despite intense competitor activity. The operating profit of
both Vodafone New Zealand and Vodafone Australia improved, due largely to the cost
savings from operational efficiencies.
Vodafone Fiji increased its customer base by 25% and its operating profit improved.
China Mobile, in which the Group has a 3.27% stake, increased its customer base by
21% to 150,256,000 in the year ended 31 March 2004. ARPU continued to fall with
the increase in low usage customers. Dividends totalling £25 million were received
from China Mobile during the year.
The Group disposed of its interest in its Indian associate, RPG Cellular Services Ltd,
during the 2004 financial year.
In November 2003, a Partner Network Agreement was announced with M1 in
Singapore, the first Vodafone partner in this region.