Vodafone 2005 Annual Report Download - page 122
Download and view the complete annual report
Please find page 122 of the 2005 Vodafone annual report below. You can navigate through the pages in the report by either clicking on the pages listed below, or by using the keyword search tool below to find specific information within the annual report.-
 1
1 -
2
-
3
-
4
-
5
-
6
-
7
-
8
-
9
-
10
-
11
-
12
-
13
-
14
-
15
-
16
-
17
-
18
-
19
-
20
-
21
-
22
-
23
-
24
-
25
-
26
-
27
-
28
-
29
-
30
-
31
-
32
-
33
-
34
-
35
-
36
-
37
-
38
-
39
-
40
-
41
-
42
-
43
-
44
-
45
-
46
-
47
-
48
-
49
-
50
-
51
-
52
-
53
-
54
-
55
-
56
-
57
-
58
-
59
-
60
-
61
-
62
-
63
-
64
-
65
-
66
-
67
-
68
-
69
-
70
-
71
-
72
-
73
-
74
-
75
-
76
-
77
-
78
-
79
-
80
-
81
-
82
-
83
-
84
-
85
-
86
-
87
-
88
-
89
-
90
-
91
-
92
-
93
-
94
-
95
-
96
-
97
-
98
-
99
-
100
-
101
-
102
-
103
-
104
-
105
-
106
-
107
-
108
-
109
-
110
-
111
-
 112
112 -
 113
113 -
 114
114 -
 115
115 -
 116
116 -
 117
117 -
 118
118 -
 119
119 -
 120
120 -
 121
121 -
 122
122 -
 123
123 -
 124
124 -
 125
125 -
 126
126 -
 127
127 -
 128
128 -
 129
129 -
 130
130 -
 131
131 -
 132
132 -
133
-
134
-
135
-
136
-
137
-
138
-
139
-
140
-
141
-
142
-
143
-
144
-
145
-
146
-
147
-
148
-
149
-
150
-
151
-
152
-
153
-
154
-
155
-
156
 |
 |

Notes to the Consolidated Financial Statements continued
120 |Financials
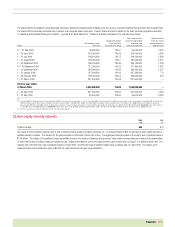
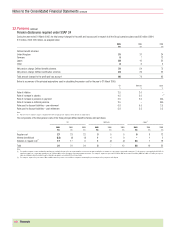
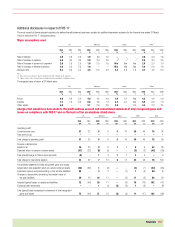
32.Pensions continued
History of amounts that would have been recognised in the statement of total recognised gains and losses under FRS 17
2005 2004 2003
£m % £m % £m %
UK Difference between the expected and actual return on assets(1) 23 4 56 13 (95) (36)
Experience gains and (losses) arising on scheme liabilities(2) (56) (9) ––––
Actuarial gain/(loss)(2) (72) (12) 40 9 (132) (34)
Germany Difference between the expected and actual return on assets(1) (1) (1) 3 2 (1) (1)
Experience gains and (losses) arising on scheme liabilities(2) (3) (1) (3) (2) 7 4
Actuarial gain/(loss)(2) (20) (9) (11) (6) (5) (3)
Japan Difference between the expected and actual return on assets(1) ––––––
Experience gains and (losses) arising on scheme liabilities(2) ––1 3 (1) (1)
Actuarial gain/(loss)(2) ––6 17 (17) (13)
Other Difference between the expected and actual return on assets(1) 237 18 (14) (37)
Experience gains and (losses) arising on scheme liabilities(2) (1) (1) 3211
Actuarial gain/(loss)(2) (10) (7) 12 10 (18) (14)
Group Difference between the expected and actual return on assets(1) 24 3 66 10 (110) (27)
Experience gains and (losses) arising on scheme liabilities(2) (60) (6) 1 – 71
Actuarial gain/(loss)(2) (102) (10) 47 6 (172) (21)
Notes:
(1) Percentage stated is expressed as a percentage of scheme assets at 31 March.
(2) Percentage stated is expressed as a percentage of scheme liabilities at 31 March.
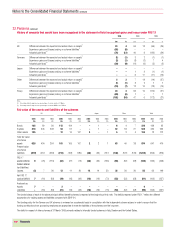
Fair value of the assets and liabilities of the schemes
UK Germany Japan Other Total
2005 2004 2003 2005 2004 2003 2005 2004 2003 2005 2004 2003 2005 2004 2003
£m £m £m £m £m £m £m £m £m £m £m £m £m £m £m
Bonds 105 89 56 115 104 – –1 – 647226 198 63
Equities 418 345 208 54 51 – –1 – 52 33 27 524 430 235
Other assets 105 ––12 10 107 2– 1 534124 13 112
Total fair value
of scheme
assets 628 434 264 181 165 107 22163 40 38 874 641 410
Present value
of scheme
liabilities (619) (457) (383) (213) (192) (180) (30) (35) (127) (148) (122) (126) (1,010) (806) (816)
FRS 17
assets/(deficits) 9(23) (119) (32) (27) (73) (28) (33) (126) (85) (82) (88) (136) (165) (406)
Related deferred
tax (liabilities)
/assets (2) 73613 11 30 12 14 53 32 30 30 55 62 149
Net FRS 17
surplus/(deficit) 7(16) (83) (19) (16) (43) (16) (19) (73) (53) (52) (58) (81) (103) (257)
Analysed as:
Assets 7––2––––––––9––
Liabilities –(16) (83) (21) (16) (43) (16) (19) (73) (53) (52) (58) (90) (103) (257)
The funded status of each of the above principal defined benefit schemes is reported at the beginning of this note. The deficits reported under FRS 17 reflect the different
assumptions for valuing assets and liabilities compared with SSAP 24.
The funding policy for the German and UK schemes is reviewed on a systematic basis in consultation with the independent scheme actuary in order to ensure that the
funding contributions from sponsoring employers are appropriate to meet the liabilities of the schemes over the long term.
The deficit in respect of other schemes at 31 March 2005 primarily relates to internally funded schemes in Italy, Sweden and the United States.