Vodafone 2005 Annual Report Download - page 43
Download and view the complete annual report
Please find page 43 of the 2005 Vodafone annual report below. You can navigate through the pages in the report by either clicking on the pages listed below, or by using the keyword search tool below to find specific information within the annual report.-
 1
1 -
2
-
3
-
4
-
5
-
6
-
7
-
8
-
9
-
10
-
11
-
12
-
13
-
14
-
15
-
16
-
17
-
18
-
19
-
20
-
21
-
22
-
23
-
24
-
25
-
26
-
27
-
28
-
29
-
30
-
31
-
32
-
 33
33 -
 34
34 -
 35
35 -
 36
36 -
 37
37 -
 38
38 -
 39
39 -
 40
40 -
 41
41 -
 42
42 -
 43
43 -
 44
44 -
 45
45 -
 46
46 -
 47
47 -
 48
48 -
 49
49 -
 50
50 -
 51
51 -
 52
52 -
 53
53 -
54
-
55
-
56
-
57
-
58
-
59
-
60
-
61
-
62
-
63
-
64
-
65
-
66
-
67
-
68
-
69
-
70
-
71
-
72
-
73
-
74
-
75
-
76
-
77
-
78
-
79
-
80
-
81
-
82
-
83
-
84
-
85
-
86
-
87
-
88
-
89
-
90
-
91
-
92
-
93
-
94
-
95
-
96
-
97
-
98
-
99
-
100
-
101
-
102
-
103
-
104
-
105
-
106
-
107
-
108
-
109
-
110
-
111
-
112
-
113
-
114
-
115
-
116
-
117
-
118
-
119
-
120
-
121
-
122
-
123
-
124
-
125
-
126
-
127
-
128
-
129
-
130
-
131
-
132
-
133
-
134
-
135
-
136
-
137
-
138
-
139
-
140
-
141
-
142
-
143
-
144
-
145
-
146
-
147
-
148
-
149
-
150
-
151
-
152
-
153
-
154
-
155
-
156
 |
 |

Performance |41
and direct access markets more than doubled in the year to 7% and 6%, respectively.
Revenue growth and further cost efficiencies generated a significantly improved
operating result and increased cash flow.
Other EMEA
Cegetel focused on increasing its share of the fast growing DSL market, growing its
DSL customer base by 566,000 to 841,000 in the year, which has led to higher
acquisition costs and adversely impacted operating profit.
Asia Pacific
The Group disposed of its interests in Japan Telecom during the 2004 financial year
and ceased consolidating the results of this business from 1 October 2003.
2004 financial year compared to 2003 financial year
Mobile businesses
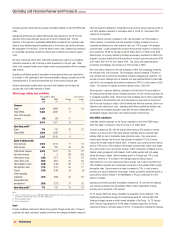
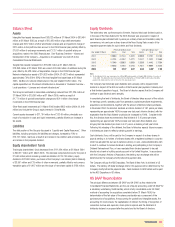
Germany
Years ended 31 March Local currency
2004 2003 Change change
£m £m % %
Turnover
Voice services 4,254 3,699 15 6
Non-voice services 895 728 23 14
Total service revenue 5,149 4,427 16 7
Equipment and other 387 327 18 10
5,536 4,754 16 8
Operating profit(1) 1,741 1,435 21 9
Notes:
(1) before goodwill amortisation and exceptional items
Vodafone Germany performed well in the 2004 financial year, further improving its
operational performance.
Turnover in Germany increased by 8% when measured in local currency, reflecting the
increase in the customer base offset by marginally lower ARPU. Germany represented
the largest mobile market in Europe in terms of customer numbers and,
notwithstanding a 10% growth in the market for the 2004 financial year, penetration, at
an estimated 80%, was still relatively low. Vodafone Germany’s customer base
increased by 9% in the 2004 financial year. The mix of contract customers increased
from 47% at 31 March 2003 to 49% at 31 March 2004, although new contract
customers had been, in general, lower usage customers than the then existing
customer base. As a result, contract ARPU fell from €519 for the 12 months ended
31 March 2003 to €494 for the 12 months ended 31 March 2004. Prepaid ARPU
remained stable at €130 during the year after increasing over the course of the prior
year. Non-voice service revenue increased by 14% when measured in local currency
and represented 17.4% of service revenue, up from 16.4% in the previous financial
year, primarily due to Vodafone live!. Increased investment in acquisition and retention
contributed to the improved churn rate and high customer growth.
Operating profit before goodwill amortisation and exceptional items improved by
£306 million to £1,741 million, principally driven by cost efficiencies in the second half
of the 2004 financial year, particularly in network and IT costs. Acquisition costs as a
percentage of turnover were also lower over the Christmas period, in comparison to the
same period in the prior financial year, due to lower handset subsidies and trade
commissions. These benefits were partially offset by higher depreciation and licence
amortisation costs as the 3G network was brought into use in February 2004.
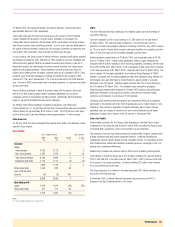
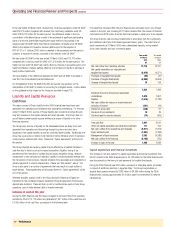
Italy
Years ended 31 March Local currency
2004 2003 Change change
£m £m % %
Turnover
Voice services 4,380 3,656 20 11
Non-voice services 669 463 44 34
Total service revenue 5,049 4,119 23 13
Equipment and other 263 278 (5) (13)
5,312 4,397 21 12
Operating profit(1) 2,143 1,588 35 23
Notes:
(1) before goodwill amortisation and exceptional items
Vodafone Italy produced another strong set of results in the 2004 financial year, in spite
of the increasingly competitive and highly penetrated market.
In local currency, turnover increased by 12% driven by a 13% growth in service
revenue, partially offset by a 13% decrease in equipment and other revenue arising
from reduced handset sales. The increase in service revenue was driven by the larger
customer base and increased usage, particularly of data services, partially offset by the
impact of regulatory changes on interconnect rates. Non-voice service revenue
improved significantly, to represent 13.3% of service revenue for the year (2003:
11.3%), mainly due to SMS but also the positive contribution from Vodafone live! and
Vodafone Mobile Connect data card. Blended ARPU increased by 4% to €361
following the rise in prepaid ARPU from €298 to €309 and contract ARPU increased by
10% to €900.
Vodafone Italy responded to increased competition levels in the Italian market with
continued investment in the Vodafone One loyalty scheme and retail stores, coupled
with a strong focus on business and higher value customers. This contributed to the
increase in ARPU and the reduction in churn.
Operating profit before goodwill amortisation and exceptional items grew significantly,
partially as a result of a reduction in acquisition and retention costs, as a percentage of
revenue, operational efficiencies and no accrual being made for a contribution tax
levied by the local regulatory authority following a favourable European Court of Justice
ruling on its legality. These factors were partially offset by higher interconnect costs,
due to higher interconnect volume and increased international roaming traffic, and the
commencement of depreciation on the 3G network and the related licence
amortisation.
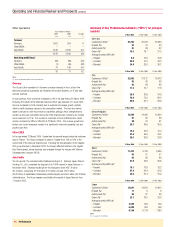
United Kingdom
Years ended 31 March
2004 2003 Change
£m £m %
Turnover
Voice services 3,522 3,207 10
Non-voice services 674 541 25
Total service revenue 4,196 3,748 12
Equipment and other 586 307 91
4,782 4,055 18
Operating profit(1) 1,098 1,120 (2)
Notes:
(1) before goodwill amortisation and exceptional items
Vodafone UK successfully maintained its leading market position in the 2004 financial
year, based on revenue share, according to the regulator’s last published data for that
year, in line with its strategic objectives, despite pricing pressures caused by
intensifying competition and regulatory activity.