Vodafone 2005 Annual Report Download - page 127
Download and view the complete annual report
Please find page 127 of the 2005 Vodafone annual report below. You can navigate through the pages in the report by either clicking on the pages listed below, or by using the keyword search tool below to find specific information within the annual report.-
 1
1 -
2
-
3
-
4
-
5
-
6
-
7
-
8
-
9
-
10
-
11
-
12
-
13
-
14
-
15
-
16
-
17
-
18
-
19
-
20
-
21
-
22
-
23
-
24
-
25
-
26
-
27
-
28
-
29
-
30
-
31
-
32
-
33
-
34
-
35
-
36
-
37
-
38
-
39
-
40
-
41
-
42
-
43
-
44
-
45
-
46
-
47
-
48
-
49
-
50
-
51
-
52
-
53
-
54
-
55
-
56
-
57
-
58
-
59
-
60
-
61
-
62
-
63
-
64
-
65
-
66
-
67
-
68
-
69
-
70
-
71
-
72
-
73
-
74
-
75
-
76
-
77
-
78
-
79
-
80
-
81
-
82
-
83
-
84
-
85
-
86
-
87
-
88
-
89
-
90
-
91
-
92
-
93
-
94
-
95
-
96
-
97
-
98
-
99
-
100
-
101
-
102
-
103
-
104
-
105
-
106
-
107
-
108
-
109
-
110
-
111
-
112
-
113
-
114
-
115
-
116
-
 117
117 -
 118
118 -
 119
119 -
 120
120 -
 121
121 -
 122
122 -
 123
123 -
 124
124 -
 125
125 -
 126
126 -
 127
127 -
 128
128 -
 129
129 -
 130
130 -
 131
131 -
 132
132 -
 133
133 -
 134
134 -
 135
135 -
 136
136 -
 137
137 -
138
-
139
-
140
-
141
-
142
-
143
-
144
-
145
-
146
-
147
-
148
-
149
-
150
-
151
-
152
-
153
-
154
-
155
-
156
 |
 |

Financials |125
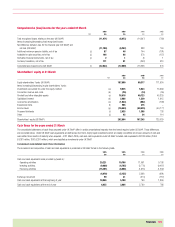
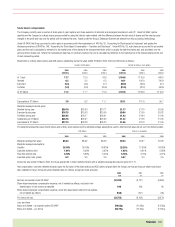
Comprehensive (loss)/income for the years ended 31 March
2005 2005 2004 2003
Ref. $m £m £m £m
Total recognised losses relating to the year (UK GAAP) (11,471) (6,073) (14,307) (780)
Items (increasing)/decreasing total recognised losses:
Net difference between loss for the financial year (UK GAAP) and
net loss (US GAAP) (11,789) (6,242) 888 764
Additional minimum pension liability, net of tax (j) 87 46 144 (191)
Available for sale securities, net of tax (j) 166 88 378 (137)
Derivative financial instruments, net of tax (j) 21(1) 1
Currency translation, net of tax 171 91 (353) 913
Comprehensive (loss)/income (US GAAP) (l) (22,834) (12,089) (13,251) 570
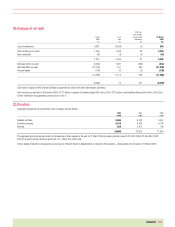
Shareholders’ equity at 31 March
2005 2005 2004
Ref. $m £m £m
Equity shareholders’ funds (UK GAAP) 187,590 99,317 111,924
Items increasing/(decreasing) equity shareholders’ funds:
Investments accounted for under the equity method (a) 9,525 5,043 15,669
Connection revenue and costs (b) (26) (14) (55)
Goodwill and other intangible assets (c) 76,918 40,723 45,320
Capitalised interest (d) 2,888 1,529 1,615
Licence fee amortisation (e) (1,043) (552) (109)
Exceptional items (f) 595 315 –
Income taxes (g) (76,563) (40,535) (50,177)
Proposed dividends (i) 2,635 1,395 728
Other (j) 45 24 114
Shareholders’ equity (US GAAP) 202,564 107,245 125,029
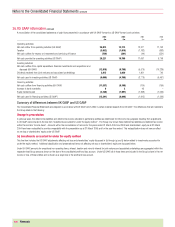
Cash flows for the years ended 31 March
The consolidated statements of cash flows prepared under UK GAAP differ in certain presentational respects from the format required under US GAAP. These differences
are reconciled below. Under US GAAP, cash equivalents are defined as short term, highly liquid investments which are readily convertible into known amounts of cash and
were within three months of maturity when acquired. At 31 March 2005, cash and cash equivalents under US GAAP included cash equivalents of £816 million (2004:
£4,381 million; 2003: £291 million), which are classified as investments under UK GAAP.
Condensed consolidated cash flow information
The movement and composition of cash and cash equivalents is presented in US GAAP format in the following table.
2005 2005 2004 2003
$m £m £m £m
Cash and cash equivalents were provided by/(used in):
Operating activities 20,221 10,706 11,091 9,708
Investing activities (9,000) (4,765) (3,778) (9,497)
Financing activities (15,291) (8,096) (1,915) (1,202)
(4,070) (2,155) 5,398 (991)
Exchange movement 59 31 (374) (112)
Cash and cash equivalents at the beginning of year 10,936 5,790 766 1,869
Cash and cash equivalents at the end of year 6,925 3,666 5,790 766