Vodafone 2005 Annual Report Download - page 105
Download and view the complete annual report
Please find page 105 of the 2005 Vodafone annual report below. You can navigate through the pages in the report by either clicking on the pages listed below, or by using the keyword search tool below to find specific information within the annual report.-
 1
1 -
2
-
3
-
4
-
5
-
6
-
7
-
8
-
9
-
10
-
11
-
12
-
13
-
14
-
15
-
16
-
17
-
18
-
19
-
20
-
21
-
22
-
23
-
24
-
25
-
26
-
27
-
28
-
29
-
30
-
31
-
32
-
33
-
34
-
35
-
36
-
37
-
38
-
39
-
40
-
41
-
42
-
43
-
44
-
45
-
46
-
47
-
48
-
49
-
50
-
51
-
52
-
53
-
54
-
55
-
56
-
57
-
58
-
59
-
60
-
61
-
62
-
63
-
64
-
65
-
66
-
67
-
68
-
69
-
70
-
71
-
72
-
73
-
74
-
75
-
76
-
77
-
78
-
79
-
80
-
81
-
82
-
83
-
84
-
85
-
86
-
87
-
88
-
89
-
90
-
91
-
92
-
93
-
94
-
 95
95 -
 96
96 -
 97
97 -
 98
98 -
 99
99 -
 100
100 -
 101
101 -
 102
102 -
 103
103 -
 104
104 -
 105
105 -
 106
106 -
 107
107 -
 108
108 -
 109
109 -
 110
110 -
 111
111 -
 112
112 -
 113
113 -
 114
114 -
 115
115 -
116
-
117
-
118
-
119
-
120
-
121
-
122
-
123
-
124
-
125
-
126
-
127
-
128
-
129
-
130
-
131
-
132
-
133
-
134
-
135
-
136
-
137
-
138
-
139
-
140
-
141
-
142
-
143
-
144
-
145
-
146
-
147
-
148
-
149
-
150
-
151
-
152
-
153
-
154
-
155
-
156
 |
 |

Financials |103
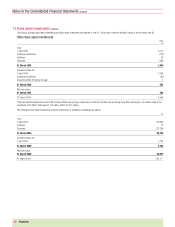
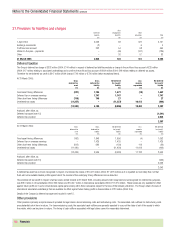
Financial liabilities and assets
The Group uses short term foreign exchange instruments for managing both liquidity and the currency mix of Group net debt. The net position of the Group’s short term
foreign exchange deals at 31 March 2005 is an asset, however, for the purpose of this note they are included within the financial liabilities section below as they are primarily
used to manage the currency profile of the Group’s gross debt. Foreign exchange instruments hedging items other than borrowings are disclosed in the table. Short term
debtors and creditors are not included in the analyses in this note or those in note 20.
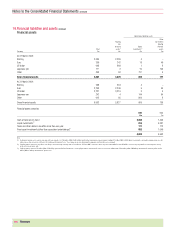
Interest rate and currency of financial liabilities
Non-interest
bearing
Fixed rate financial financial
liabilities liabilities
Financial
liabilities Non- Weighted
net of Floating interest Weighted average Weighted
Gross Foreign foreign rate Fixed rate bearing average time for average
financial exchange exchange financial financial financial interest which rate period until
liabilities instruments instruments liabilities liabilities liabilities rate is fixed maturity
Currency £m £m £m £m £m £m % Years Years
At 31 March 2005:
Sterling 1,104 (570) 534 534 –––––
Euro 4,811 1,487 6,298 5,314 978 6 5.0 11.6 2.7
US dollar 3,984 (2,703) 1,281 1,281 –––––
Japanese yen 2,066 1,913 3,979 3,973 – 6 ––5.0
Other 52 (155) (103) (103) –––––
Gross financial liabilities 12,017 (28) 11,989 10,999 978 12 5.0 11.6 3.9
At 31 March 2004:
Sterling 1,110 (2,456) (1,346) (1,346) –––––
Euro 5,670 1,553 7,223 5,282 1,941 – 5.0 6.4 –
US dollar 4,953 (1,487) 3,466 2,608 858 – 7.6 0.9 –
Japanese yen 2,218 2,618 4,836 4,798 31 7 1.6 0.7 1.5
Other 254 (148) 106 106 –––––
Gross financial liabilities 14,205 80 14,285 11,448 2,830 7 5.7 4.7 1.5
Interest on floating rate borrowings is based on national London Inter Bank Offered Rate equivalents or government bond rates in the relevant currencies.
The figures shown in the tables above take into account interest rate swaps used to manage the interest rate profile of financial liabilities.
Further protection from euro and Japanese yen interest rate movements on debt is provided by forward starting interest rate swaps (“IRS”). The Group has entered into euro
denominated forward starting IRS which cover the period December 2005 to June 2007 for an amount equal to £1,511 million (2004: £1,471 million). The effective rate
which has been fixed is equal to 3.54% per annum. The Group has entered into Japanese yen denominated forward starting IRS and interest rate futures which cover the
period June 2005 to September 2005, September 2005 to December 2005, December 2005 to March 2006 and March 2006 to March 2007 for amounts equal to £3,075
million (2004: £3,256 million), £988 million (2004: £3,635 million), £988 million (2004: £1,046 million) and £3,755 million (2004: £3,975 million), respectively. The
effective rates, which have been fixed, range from 0.329% per annum to 0.362% per annum.