Vodafone 2005 Annual Report Download - page 96
Download and view the complete annual report
Please find page 96 of the 2005 Vodafone annual report below. You can navigate through the pages in the report by either clicking on the pages listed below, or by using the keyword search tool below to find specific information within the annual report.-
 1
1 -
2
-
3
-
4
-
5
-
6
-
7
-
8
-
9
-
10
-
11
-
12
-
13
-
14
-
15
-
16
-
17
-
18
-
19
-
20
-
21
-
22
-
23
-
24
-
25
-
26
-
27
-
28
-
29
-
30
-
31
-
32
-
33
-
34
-
35
-
36
-
37
-
38
-
39
-
40
-
41
-
42
-
43
-
44
-
45
-
46
-
47
-
48
-
49
-
50
-
51
-
52
-
53
-
54
-
55
-
56
-
57
-
58
-
59
-
60
-
61
-
62
-
63
-
64
-
65
-
66
-
67
-
68
-
69
-
70
-
71
-
72
-
73
-
74
-
75
-
76
-
77
-
78
-
79
-
80
-
81
-
82
-
83
-
84
-
85
-
 86
86 -
 87
87 -
 88
88 -
 89
89 -
 90
90 -
 91
91 -
 92
92 -
 93
93 -
 94
94 -
 95
95 -
 96
96 -
 97
97 -
 98
98 -
 99
99 -
 100
100 -
 101
101 -
 102
102 -
 103
103 -
 104
104 -
 105
105 -
 106
106 -
107
-
108
-
109
-
110
-
111
-
112
-
113
-
114
-
115
-
116
-
117
-
118
-
119
-
120
-
121
-
122
-
123
-
124
-
125
-
126
-
127
-
128
-
129
-
130
-
131
-
132
-
133
-
134
-
135
-
136
-
137
-
138
-
139
-
140
-
141
-
142
-
143
-
144
-
145
-
146
-
147
-
148
-
149
-
150
-
151
-
152
-
153
-
154
-
155
-
156
 |
 |

Notes to the Consolidated Financial Statements continued
94 |Financials
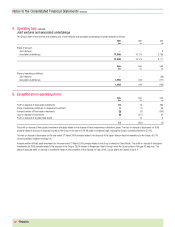
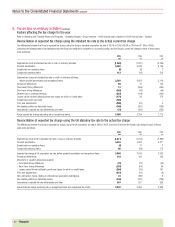
10.Loss per share
2005 2004 2003
Weighted average number of shares (millions) in issue during the year and used to
calculate basic and diluted loss per share: 66,196 68,096 68,155
£m £m £m
Loss for basic and diluted loss per share (7,540) (9,015) (9,819)
Pence Pence Pence
per share per share per share
Basic and diluted loss per share (11.39) (13.24) (14.41)
£m £m £m
Basic loss per share is stated inclusive of the following items:
Amortisation of goodwill 14,700 15,207 14,056
Exceptional operating items 315 (228) 576
Exceptional non-operating items (13) 103 5
Exceptional tax credit (599) ––
Tax on exceptional items 3104 (37)
Share of exceptional items attributable to minority interests 26 27 (139)
Pence Pence Pence
per share per share per share
Amortisation of goodwill 22.21 22.33 20.62
Exceptional operating items 0.48 (0.33) 0.85
Exceptional non-operating items (0.02) 0.15 0.01
Exceptional tax credit (0.91) ––
Tax on exceptional items –0.15 (0.06)
Share of exceptional items attributable to minority interests 0.04 0.04 (0.20)
Basic loss per share represents the net loss attributable to ordinary shareholders, being the loss on ordinary activities after taxation and minority interests. Diluted loss per
share is the same as basic loss per share as it is considered that there are no dilutive potential ordinary shares.