Vodafone 2005 Annual Report Download - page 80
Download and view the complete annual report
Please find page 80 of the 2005 Vodafone annual report below. You can navigate through the pages in the report by either clicking on the pages listed below, or by using the keyword search tool below to find specific information within the annual report.-
 1
1 -
2
-
3
-
4
-
5
-
6
-
7
-
8
-
9
-
10
-
11
-
12
-
13
-
14
-
15
-
16
-
17
-
18
-
19
-
20
-
21
-
22
-
23
-
24
-
25
-
26
-
27
-
28
-
29
-
30
-
31
-
32
-
33
-
34
-
35
-
36
-
37
-
38
-
39
-
40
-
41
-
42
-
43
-
44
-
45
-
46
-
47
-
48
-
49
-
50
-
51
-
52
-
53
-
54
-
55
-
56
-
57
-
58
-
59
-
60
-
61
-
62
-
63
-
64
-
65
-
66
-
67
-
68
-
69
-
 70
70 -
 71
71 -
 72
72 -
 73
73 -
 74
74 -
 75
75 -
 76
76 -
 77
77 -
 78
78 -
 79
79 -
 80
80 -
 81
81 -
 82
82 -
 83
83 -
 84
84 -
 85
85 -
 86
86 -
 87
87 -
 88
88 -
 89
89 -
 90
90 -
91
-
92
-
93
-
94
-
95
-
96
-
97
-
98
-
99
-
100
-
101
-
102
-
103
-
104
-
105
-
106
-
107
-
108
-
109
-
110
-
111
-
112
-
113
-
114
-
115
-
116
-
117
-
118
-
119
-
120
-
121
-
122
-
123
-
124
-
125
-
126
-
127
-
128
-
129
-
130
-
131
-
132
-
133
-
134
-
135
-
136
-
137
-
138
-
139
-
140
-
141
-
142
-
143
-
144
-
145
-
146
-
147
-
148
-
149
-
150
-
151
-
152
-
153
-
154
-
155
-
156
 |
 |

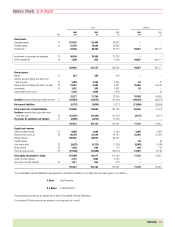
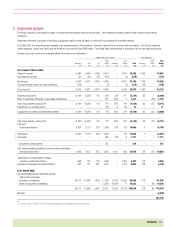
78 |Financials
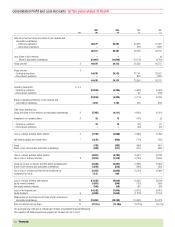
2005 2005 2004 2003
Note $m £m £m £m
Total Group turnover: Group and share of joint ventures and
associated undertakings
– Continuing operations 86,471 45,781 42,920 37,324
– Discontinued operations ––818 1,828
86,471 45,781 43,738 39,152
Less: Share of joint ventures –––(8)
Share of associated undertakings (22,001) (11,648) (10,179) (8,769)
Group turnover 3 64,470 34,133 33,559 30,375
Group turnover 3
– Continuing operations 64,470 34,133 32,741 28,547
– Discontinued operations ––818 1,828
64,470 34,133 33,559 30,375
Operating (loss)/profit 3,4,5
– Continuing operations (10,018) (5,304) (4,842) (5,052)
– Discontinued operations ––66 (243)
(10,018) (5,304) (4,776) (5,295)
Share of operating profit/(loss) in joint ventures and
associated undertakings 2,253 1,193 546 (156)
Total Group operating loss
Group and share of joint ventures and associated undertakings 3 (7,765) (4,111) (4,230) (5,451)
Exceptional non-operating items 6 25 13 (103) (5)
– Continuing operations 25 13 (44) 20
– Discontinued operations ––(59) (25)
Loss on ordinary activities before interest 3 (7,740) (4,098) (4,333) (5,456)
Net interest payable and similar items 7 (1,141) (604) (714) (752)
Group (742) (393) (499) (457)
Share of joint ventures and associated undertakings (399) (211) (215) (295)
Loss on ordinary activities before taxation (8,881) (4,702) (5,047) (6,208)
Tax on loss on ordinary activities 8 (4,224) (2,236) (3,154) (2,956)
Group tax on loss on ordinary activities before exceptional tax (4,339) (2,297) (2,866) (2,624)
Share of joint ventures and associated undertakings (1,016) (538) (288) (332)
Tax on loss on ordinary activities before exceptional tax (5,355) (2,835) (3,154) (2,956)
Exceptional tax credit 1,131 599 ––
Loss on ordinary activities after taxation (13,105) (6,938) (8,201) (9,164)
Equity minority interests (1,031) (546) (753) (593)
Non-equity minority interests (106) (56) (61) (62)
Loss for the financial year (14,242) (7,540) (9,015) (9,819)
Equity dividends 9 (5,020) (2,658) (1,378) (1,154)
Retained loss for the Group and its share of joint ventures and
associated undertakings 23 (19,262) (10,198) (10,393) (10,973)
Basic and diluted loss per share 10 (21.51)¢ (11.39)p (13.24)p (14.41)p
The accompanying notes are an integral part of these Consolidated Financial Statements.
The unaudited US dollar amounts are prepared on the basis set out in note 1.
Consolidated Profit and Loss Accounts for the years ended 31 March