Vodafone 2005 Annual Report Download - page 129
Download and view the complete annual report
Please find page 129 of the 2005 Vodafone annual report below. You can navigate through the pages in the report by either clicking on the pages listed below, or by using the keyword search tool below to find specific information within the annual report.-
 1
1 -
2
-
3
-
4
-
5
-
6
-
7
-
8
-
9
-
10
-
11
-
12
-
13
-
14
-
15
-
16
-
17
-
18
-
19
-
20
-
21
-
22
-
23
-
24
-
25
-
26
-
27
-
28
-
29
-
30
-
31
-
32
-
33
-
34
-
35
-
36
-
37
-
38
-
39
-
40
-
41
-
42
-
43
-
44
-
45
-
46
-
47
-
48
-
49
-
50
-
51
-
52
-
53
-
54
-
55
-
56
-
57
-
58
-
59
-
60
-
61
-
62
-
63
-
64
-
65
-
66
-
67
-
68
-
69
-
70
-
71
-
72
-
73
-
74
-
75
-
76
-
77
-
78
-
79
-
80
-
81
-
82
-
83
-
84
-
85
-
86
-
87
-
88
-
89
-
90
-
91
-
92
-
93
-
94
-
95
-
96
-
97
-
98
-
99
-
100
-
101
-
102
-
103
-
104
-
105
-
106
-
107
-
108
-
109
-
110
-
111
-
112
-
113
-
114
-
115
-
116
-
117
-
118
-
 119
119 -
 120
120 -
 121
121 -
 122
122 -
 123
123 -
 124
124 -
 125
125 -
 126
126 -
 127
127 -
 128
128 -
 129
129 -
 130
130 -
 131
131 -
 132
132 -
 133
133 -
 134
134 -
 135
135 -
 136
136 -
 137
137 -
 138
138 -
 139
139 -
140
-
141
-
142
-
143
-
144
-
145
-
146
-
147
-
148
-
149
-
150
-
151
-
152
-
153
-
154
-
155
-
156
 |
 |

Financials |127
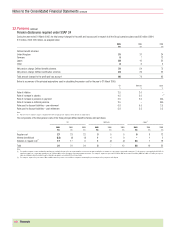
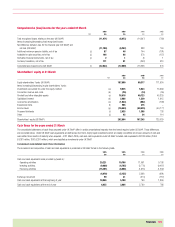
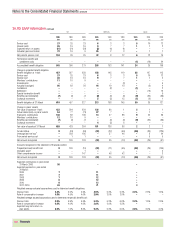
Condensed financial information for Vodafone Italy
The basis of consolidation under UK GAAP differs from that under US GAAP. Under UK GAAP, the results and net assets of Vodafone Italy are consolidated in the Group’s
financial statements. Under US GAAP, as a result of significant participating rights held by minority shareholders, the Group’s interest in Vodafone Italy has been accounted for
under the equity method of accounting.
The following tables present, on a condensed basis, the financial information of Vodafone Italy as it is included in the Consolidated Profit and Loss Account and Consolidated
Balance Sheet prepared under UK GAAP.
2005 2004 2003
£m £m £m
Turnover 5,521 5,276 4,371
Cost of sales (2,578) (2,132) (2,201)
Gross margin 2,943 3,144 2,170
Selling and distribution costs (213) (211) (182)
Administrative expenses (4,252) (4,276) (3,943)
Goodwill amortisation (3,779) (3,837) (3,543)
Other administrative expenses (473) (439) (400)
Operating loss (1,522) (1,343) (1,955)
Other income/ (expense) 14 (12)
Loss on ordinary activities before taxation (1,521) (1,339) (1,967)
Tax on loss on ordinary activities (660) (583) (478)
Equity minority interest (384) (459) (264)
Loss for the financial year (2,565) (2,381) (2,709)
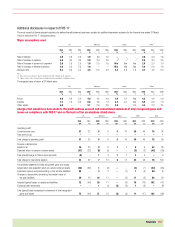
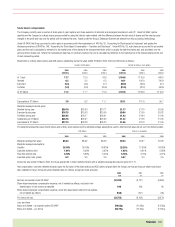
2005 2004
£m £m
Goodwill 16,162 19,443
Other intangible assets 1,690 1,666
Tangible assets 2,006 1,934
Fixed assets 19,858 23,043
Debtors 1,349 1,220
Other current assets 73 82
Current assets 1,422 1,302
Total assets 21,280 24,345
Creditors: amounts falling due within one year (1,630) (1,587)
Non-current creditors and provisions (560) (518)
19,090 22,240
Total equity shareholders’ funds 17,280 20,855
Equity minority interests 1,810 1,385
19,090 22,240