Vodafone 2005 Annual Report Download - page 106
Download and view the complete annual report
Please find page 106 of the 2005 Vodafone annual report below. You can navigate through the pages in the report by either clicking on the pages listed below, or by using the keyword search tool below to find specific information within the annual report.-
 1
1 -
2
-
3
-
4
-
5
-
6
-
7
-
8
-
9
-
10
-
11
-
12
-
13
-
14
-
15
-
16
-
17
-
18
-
19
-
20
-
21
-
22
-
23
-
24
-
25
-
26
-
27
-
28
-
29
-
30
-
31
-
32
-
33
-
34
-
35
-
36
-
37
-
38
-
39
-
40
-
41
-
42
-
43
-
44
-
45
-
46
-
47
-
48
-
49
-
50
-
51
-
52
-
53
-
54
-
55
-
56
-
57
-
58
-
59
-
60
-
61
-
62
-
63
-
64
-
65
-
66
-
67
-
68
-
69
-
70
-
71
-
72
-
73
-
74
-
75
-
76
-
77
-
78
-
79
-
80
-
81
-
82
-
83
-
84
-
85
-
86
-
87
-
88
-
89
-
90
-
91
-
92
-
93
-
94
-
95
-
 96
96 -
 97
97 -
 98
98 -
 99
99 -
 100
100 -
 101
101 -
 102
102 -
 103
103 -
 104
104 -
 105
105 -
 106
106 -
 107
107 -
 108
108 -
 109
109 -
 110
110 -
 111
111 -
 112
112 -
 113
113 -
 114
114 -
 115
115 -
 116
116 -
117
-
118
-
119
-
120
-
121
-
122
-
123
-
124
-
125
-
126
-
127
-
128
-
129
-
130
-
131
-
132
-
133
-
134
-
135
-
136
-
137
-
138
-
139
-
140
-
141
-
142
-
143
-
144
-
145
-
146
-
147
-
148
-
149
-
150
-
151
-
152
-
153
-
154
-
155
-
156
 |
 |

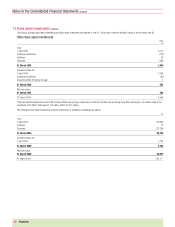
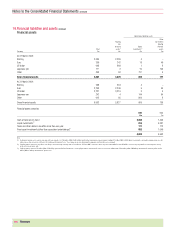
Notes to the Consolidated Financial Statements continued
104 |Financials
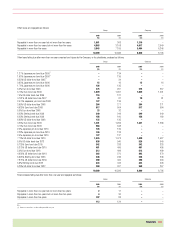
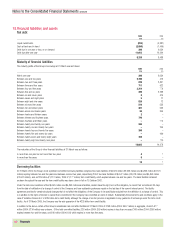
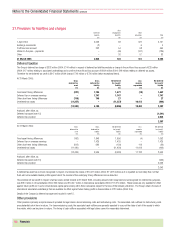
19.Financial liabilities and assets continued
Financial assets
Non-interest bearing assets
Other
Floating non-interest
rate bearing
financial Equity financial
Total assets(1) investments(2) assets
Currency £m £m £m £m
At 31 March 2005:
Sterling 2,389 2,385 4 –
Euro 309 242 18 49
US dollar 998 989 1 8
Japanese yen 117 2 10 105
Other 848 52 787 9
Gross financial assets 4,661 3,670 820 171
At 31 March 2004:
Sterling 268 264 4 –
Euro 2,299 2,245 9 45
US dollar 3,231 3,219 3 9
Japanese yen 242 4 144 94
Other 912 95 809 8
Gross financial assets 6,952 5,827 969 156
Financial assets comprise:
2005 2004
£m £m
Cash at bank and in hand 2,850 1,409
Liquid investments(2) 816 4,381
Trade and other debtors due after more than one year 171 113
Fixed asset investments (other than associated undertakings)(3) 852 1,049
4,689 6,952
Notes:
(1) Floating rate financial assets comprise cash and short term deposits of £3,126 million (2004: £3,802 million) and US dollar denominated commercial paper totalling £512 million (2004: £2,025 million), invested with counterparties having a single-A credit
rating or above from at least two of Moody’s, Fitch Ratings and Standard & Poor’s. These ratings are used in determining the aggregate credit risk with each counterparty.
(2) Liquid investments include the net position of the Group’s short term foreign exchange deals of £28 million at 31 March 2005. In the notes above, they are included within the financial liabilities section as they are primarily used to manage the currency
profile of the Group’s gross debt.
(3) Equity investments include £788 million (2004: £810 million) represented by listed investments. Listed equity investments denominated in currencies other than sterling include £786 million (2004: £809 million) denominated in Hong Kong dollars and £2
million (2004: £1 million) denominated in Japanese yen.