Vodafone 2005 Annual Report Download - page 69
Download and view the complete annual report
Please find page 69 of the 2005 Vodafone annual report below. You can navigate through the pages in the report by either clicking on the pages listed below, or by using the keyword search tool below to find specific information within the annual report.-
 1
1 -
2
-
3
-
4
-
5
-
6
-
7
-
8
-
9
-
10
-
11
-
12
-
13
-
14
-
15
-
16
-
17
-
18
-
19
-
20
-
21
-
22
-
23
-
24
-
25
-
26
-
27
-
28
-
29
-
30
-
31
-
32
-
33
-
34
-
35
-
36
-
37
-
38
-
39
-
40
-
41
-
42
-
43
-
44
-
45
-
46
-
47
-
48
-
49
-
50
-
51
-
52
-
53
-
54
-
55
-
56
-
57
-
58
-
 59
59 -
 60
60 -
 61
61 -
 62
62 -
 63
63 -
 64
64 -
 65
65 -
 66
66 -
 67
67 -
 68
68 -
 69
69 -
 70
70 -
 71
71 -
 72
72 -
 73
73 -
 74
74 -
 75
75 -
 76
76 -
 77
77 -
 78
78 -
 79
79 -
80
-
81
-
82
-
83
-
84
-
85
-
86
-
87
-
88
-
89
-
90
-
91
-
92
-
93
-
94
-
95
-
96
-
97
-
98
-
99
-
100
-
101
-
102
-
103
-
104
-
105
-
106
-
107
-
108
-
109
-
110
-
111
-
112
-
113
-
114
-
115
-
116
-
117
-
118
-
119
-
120
-
121
-
122
-
123
-
124
-
125
-
126
-
127
-
128
-
129
-
130
-
131
-
132
-
133
-
134
-
135
-
136
-
137
-
138
-
139
-
140
-
141
-
142
-
143
-
144
-
145
-
146
-
147
-
148
-
149
-
150
-
151
-
152
-
153
-
154
-
155
-
156
 |
 |

Governance |67
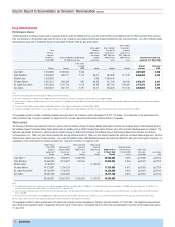
Performance shares
Performance shares are awarded annually to executive directors. Vesting of the
performance shares depends upon the Company’s relative TSR performance. TSR
measures the change in value of a share and reinvested dividends over the period of
measurement. The Company’s TSR performance is compared to that of other
companies in the FTSE Global Telecommunications index over a three-year
performance period. The Vodafone Group Plc 1999 Long Term Stock Incentive Plan is
the vehicle for the provision of these incentive awards.
In the 2005 financial year, the Chief Executive received an award of Performance
shares with a face value of two times base salary; the Deputy Chief Executive and
other executive directors one and a half times their base salary.
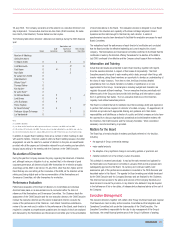
Performance shares will vest only if the Company ranks in the top half of the ranking
table; maximum vesting will only occur if the Company is in the top 20%. Vesting is
also conditional on underlying improvement in the performance of the Company.
Awards will vest to the extent that the performance condition has been satisfied at the
end of the three-year performance period. To the extent that the performance target is
not met, the awards will be forfeited. The following chart shows the basis on which the
performance shares will vest:
The constituents of the FTSE Global Telecommunications index as at July 2004,
(applicable to awards in the 2005 financial year), excluding the Company, were:
Alltel Portugal Telecom
AT&T Royal KPN
AT&T Wireless Services Inc SBC Communications
BCE Singapore Telecommunications
BellSouth Sprint Corp-FON Group
BT Group Sprint Corp-PCS Group
China Mobile Hong Kong Swisscom
China Unicom Telecom Italia
Deutsche Telekom Telefonica
France Telecom Telenor
KDDI TeliaSonera
02 Telstra
Nextel Communications TIM
Nippon Telegraph & Telephone Verizon Communications
NTT DoCoMo
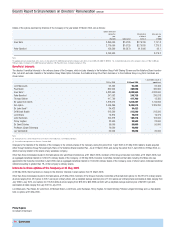
Previously disclosed performance share awards granted in the 2002 financial year
vested in the 2005 financial year. Details are given in the table on page 72.
Share options
Share options are granted annually to executive directors.
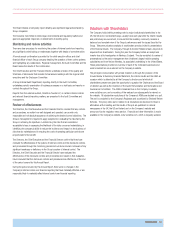
The exercise of the options is subject to the achievement of a performance condition
set prior to grant. The Remuneration Committee determined that the most appropriate
performance measure for 2004/05 awards was absolute growth in EPS, before
goodwill amortisation and exceptional items. One quarter of the option award will vest
for achievement of EPS growth of 8% p.a. rising to full vesting for achievement of EPS
growth of 18% p.a. over the performance period. In setting this target the
Remuneration Committee has taken the internal long range plan and market
expectations into account. The Remuneration Committee’s advisers have confirmed
that this EPS target is amongst the most demanding of those set by large UK based
companies. The Remuneration Committee has decided that for the 2006 financial year
grants, the performance range will be 8% – 16% p.a. The following chart illustrates
the basis on which share options granted in the 2005 financial year will vest:
Options have a ten-year term and will vest after three years, subject to performance
achievement. For options granted in the 2004 financial year, performance may be
measured again after year five from a fixed base year. The Remuneration Committee,
having considered this matter at length and taking into account the evolving views of
institutional investors, has decided to remove the performance re-test for the 2005
financial year option awards.
The price at which shares can be acquired on option exercise will be no lower than the
market value of the shares on the day prior to the date of grant of the options.
Therefore, scheme participants only benefit if the share price increases and vesting
conditions are achieved. The Vodafone Group Plc 1999 Long Term Stock Incentive
Plan is the vehicle for the provision of these incentive awards.
In July 2004, the Chief Executive received an award of options with a face value of
seven times base salary; the Deputy Chief Executive and the other executive directors
five times their base salary.
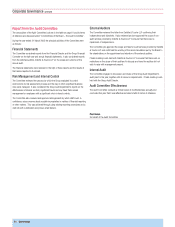
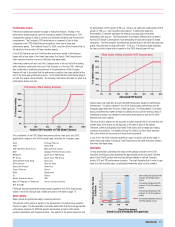
Illustration
To help shareholders understand the value of the package provided to the Chief
Executive, the following chart illustrates the approximate pre-tax long term incentive
gains to the Chief Executive that would be delivered based on various Company
growth, EPS and TSR performance scenarios. The chart illustrates that in order to gain
value from the incentive plans, considerable shareholder value must be created.
Performance Share Vesting Schedule
% of award vesting
Relative TSR Percentile vs FTSE Global Telecoms
0% 20% 40% 60% 80% 100%
100%
80%
60%
40%
20%
0%
Share Option Vesting Schedule (2005 financial year)
% of options vesting
Annualised EPS Growth
0% 8% 10% 12% 14% 16% 18% 20%
100%
120%
80%
60%
40%
20%
0%
+ £23bn
+£46bn
+£69bn
0
2
4
6
8
10
12
14
140 175 210 245
100% Vesting (80th percentile TSR
ranking & 16% EPS growth per
annum)
75% Vesting (73rd percentile TSR
ranking & 13.3% EPS growth per
annum)
50% Vesting (64th percentile TSR
ranking & 10.7% EPS growth per
annum)
25% Vesting (medianTSR ranking &
8% EPS growth per annum)
Chief Executive Pre-Tax Gain
(£'millions)
Share Price (pence)
Growth in value of Company from grant date