Vodafone 2005 Annual Report Download - page 81
Download and view the complete annual report
Please find page 81 of the 2005 Vodafone annual report below. You can navigate through the pages in the report by either clicking on the pages listed below, or by using the keyword search tool below to find specific information within the annual report.-
 1
1 -
2
-
3
-
4
-
5
-
6
-
7
-
8
-
9
-
10
-
11
-
12
-
13
-
14
-
15
-
16
-
17
-
18
-
19
-
20
-
21
-
22
-
23
-
24
-
25
-
26
-
27
-
28
-
29
-
30
-
31
-
32
-
33
-
34
-
35
-
36
-
37
-
38
-
39
-
40
-
41
-
42
-
43
-
44
-
45
-
46
-
47
-
48
-
49
-
50
-
51
-
52
-
53
-
54
-
55
-
56
-
57
-
58
-
59
-
60
-
61
-
62
-
63
-
64
-
65
-
66
-
67
-
68
-
69
-
70
-
 71
71 -
 72
72 -
 73
73 -
 74
74 -
 75
75 -
 76
76 -
 77
77 -
 78
78 -
 79
79 -
 80
80 -
 81
81 -
 82
82 -
 83
83 -
 84
84 -
 85
85 -
 86
86 -
 87
87 -
 88
88 -
 89
89 -
 90
90 -
 91
91 -
92
-
93
-
94
-
95
-
96
-
97
-
98
-
99
-
100
-
101
-
102
-
103
-
104
-
105
-
106
-
107
-
108
-
109
-
110
-
111
-
112
-
113
-
114
-
115
-
116
-
117
-
118
-
119
-
120
-
121
-
122
-
123
-
124
-
125
-
126
-
127
-
128
-
129
-
130
-
131
-
132
-
133
-
134
-
135
-
136
-
137
-
138
-
139
-
140
-
141
-
142
-
143
-
144
-
145
-
146
-
147
-
148
-
149
-
150
-
151
-
152
-
153
-
154
-
155
-
156
 |
 |

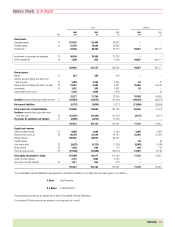
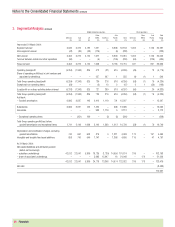
Financials |79
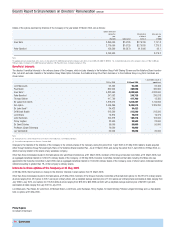
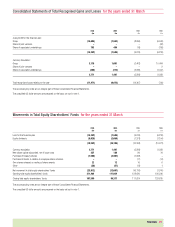
Balance Sheets at 31 March
Group Company
2005 2005 2004 2005 2004
Note $m £m £m £m £m
Fixed assets
Intangible assets 11 157,647 83,464 93,622 ––
Tangible assets 12 34,750 18,398 18,083 ––
Investments 38,248 20,250 22,275 94,027 106,177
Investments in associated undertakings 13 36,639 19,398 21,226 ––
Other investments 13 1,609 852 1,049 94,027 106,177
230,645 122,112 133,980 94,027 106,177
Current assets
Stocks 14 812 430 458 ––
Debtors: amounts falling due after more
than one year 15 3,959 2,096 1,380 83 87
Debtors: amounts falling due within one year 15 10,581 5,602 5,521 76,655 65,540
Investments 16 1,541 816 4,381 28 –
Cash at bank and in hand 5,384 2,850 1,409 –53
22,277 11,794 13,149 76,766 65,680
Creditors: amounts falling due within one year 17 (28,024) (14,837) (15,026) (90,425) (95,679)
Net current liabilities (5,747) (3,043) (1,877) (13,659) (29,999)
Total assets less current liabilities 224,898 119,069 132,103 80,368 76,178
Creditors: amounts falling due after more
than one year 18 (23,387) (12,382) (12,975) (9,174) (9,271)
Provisions for liabilities and charges 21 (8,598) (4,552) (4,197) ––
192,913 102,135 114,931 71,194 66,907
Capital and reserves
Called up share capital 22 8,095 4,286 4,280 4,286 4,280
Share premium account 23 98,754 52,284 52,154 52,284 52,154
Merger reserve 186,853 98,927 98,927 ––
Capital reserve –––88 88
Own shares held 23 (9,672) (5,121) (1,136) (5,085) (1,088)
Other reserve 23 1,188 629 713 629 713
Profit and loss account 23 (97,628) (51,688) (43,014) 18,992 10,760
Total equity shareholders’ funds 187,590 99,317 111,924 71,194 66,907
Equity minority interests 3,712 1,965 2,132 ––
Non-equity minority interests 24 1,611 853 875 ––
192,913 102,135 114,931 71,194 66,907
The Consolidated Financial Statements were approved by the Board of directors on 24 May 2005 and were signed on its behalf by:
A Sarin Chief Executive
K J Hydon Financial Director
The accompanying notes are an integral part of these Consolidated Financial Statements.
The unaudited US dollar amounts are prepared on the basis set out in note 1.