Vodafone 2005 Annual Report Download - page 137
Download and view the complete annual report
Please find page 137 of the 2005 Vodafone annual report below. You can navigate through the pages in the report by either clicking on the pages listed below, or by using the keyword search tool below to find specific information within the annual report.-
 1
1 -
2
-
3
-
4
-
5
-
6
-
7
-
8
-
9
-
10
-
11
-
12
-
13
-
14
-
15
-
16
-
17
-
18
-
19
-
20
-
21
-
22
-
23
-
24
-
25
-
26
-
27
-
28
-
29
-
30
-
31
-
32
-
33
-
34
-
35
-
36
-
37
-
38
-
39
-
40
-
41
-
42
-
43
-
44
-
45
-
46
-
47
-
48
-
49
-
50
-
51
-
52
-
53
-
54
-
55
-
56
-
57
-
58
-
59
-
60
-
61
-
62
-
63
-
64
-
65
-
66
-
67
-
68
-
69
-
70
-
71
-
72
-
73
-
74
-
75
-
76
-
77
-
78
-
79
-
80
-
81
-
82
-
83
-
84
-
85
-
86
-
87
-
88
-
89
-
90
-
91
-
92
-
93
-
94
-
95
-
96
-
97
-
98
-
99
-
100
-
101
-
102
-
103
-
104
-
105
-
106
-
107
-
108
-
109
-
110
-
111
-
112
-
113
-
114
-
115
-
116
-
117
-
118
-
119
-
120
-
121
-
122
-
123
-
124
-
125
-
126
-
 127
127 -
 128
128 -
 129
129 -
 130
130 -
 131
131 -
 132
132 -
 133
133 -
 134
134 -
 135
135 -
 136
136 -
 137
137 -
 138
138 -
 139
139 -
 140
140 -
 141
141 -
 142
142 -
 143
143 -
 144
144 -
 145
145 -
 146
146 -
 147
147 -
148
-
149
-
150
-
151
-
152
-
153
-
154
-
155
-
156
 |
 |

Financials |135
Stock based compensation
The Company currently uses a number of share plans to grant options and share awards to its directors and employees described in note 22. Under UK GAAP, options
granted over the Company’s ordinary shares are accounted for using the intrinsic value method, with the difference between the fair value of shares and the exercise price
charged to the profit and loss over the period until the shares first vest. Grants under the Group’s Sharesave Scheme are exempt from this accounting methodology.
Under US GAAP, the Group accounts for option plans in accordance with the requirements of APB No. 25, “Accounting for Stock Issued to Employees”and applies the
disclosure provisions of SFAS No. 148, “Accounting for Stock-Based Compensation – Transition and Disclosure”. Under APB No. 25, such plans are accounted for as variable
plans and the cost is calculated by reference to the market price of the shares at the measurement date, which is usually the date the shares vest, and amortised over the
period until the shares vest. Where the measurement date has not yet been reached, the cost is calculated by reference to the market price of the relevant shares at the end
of each accounting period.
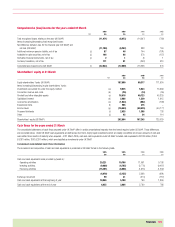
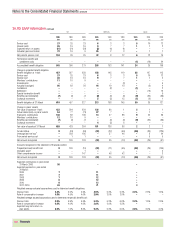
Movements in ordinary share options and ADS options outstanding during the years ended 31 March 2005, 2004 and 2003 are as follows:
Number of ADS options Number of ordinary share options
2005 2004 2003 2005 2004 2003
(millions) (millions) (millions) (millions) (millions) (millions)
At 1 April 17.7 21.0 43.8 1,184.0 1,110.9 488.3
Granted 0.2 2.2 6.5 60.1 192.0 700.9
Exercised (5.3) (4.6) (2.7) (60.0) (36.6) (9.7)
Forfeited (1.4) (0.9) (26.6) (61.5) (82.3) (68.6)
At 31 March 11.2 17.7 21.0 1,122.6 1,184.0 1,110.9
Exercisable at 31 March 7.6 9.2 11.7 353.1 107.0 90.7
Weighted average exercise price:
Granted during year $20.19 $20.34 $13.71 £1.17 £1.19 £0.99
Exercised during year $16.75 $15.03 $10.00 £0.94 £1.00 £0.82
Forfeited during year $38.05 $34.17 $33.61 £1.43 £1.34 £1.46
Outstanding at 31 March $38.76 $22.97 $22.32 £1.22 £1.16 £1.23
Exercisable at 31 March $27.74 $28.29 $25.20 £1.65 £2.13 £1.45
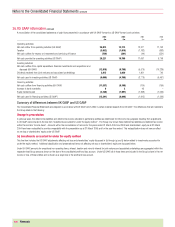
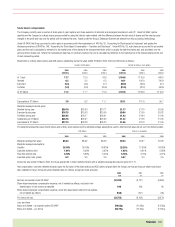
The weighted average fair value of ADS options and ordinary share options and the weighted average assumptions used to determine fair value are set out in the following table:
ADS options Ordinary share options
2005 2004 2003 2005 2004 2003)
Weighted average fair value $6.34 $5.92 $4.49 £0.33 £0.37 £0.28
Weighted average assumptions:
Volatility 26.10% 39.19% 34.83% 25.25% 37.93% 34.82%
Expected dividend yield 1.91% 0.82% 0.62% 1.92% 0.81% 0.63%
Risk-free interest rate 5.10% 3.82% 5.02% 5.16% 3.75% 4.97%
Expected option lives (years) 6.3 3.5 3.5 5.47 3.4 3.5
During the year ended 31 March 2005, the Group granted 99.1 million restricted shares with a weighted average fair value at grant of £1.11.
Had compensation cost been determined based upon the fair value of the share options and ADS options at grant date, the Group’s net loss and loss per share would have
been restated to the pro forma amounts indicated below (in millions, except per share amounts):
2005 2004 2003
£m £m £m
Net loss as reported under US GAAP (13,782) (8,127) (9,055)
Share-based employee compensation expense, net of related tax effects, included in the
determination of net income as reported 198 129 48
Share-based employee compensation expense, under fair value based method for all awards,
net of related tax effects (168) (107) (65)
Pro forma net loss (13,752) (8,105) (9,072)
Loss per share
Basic and diluted – as reported under US GAAP (20.82)p (11.93)p (13.29)p
Basic and diluted – pro forma (20.77)p (11.90)p (13.31)p