Vodafone 2005 Annual Report Download - page 4
Download and view the complete annual report
Please find page 4 of the 2005 Vodafone annual report below. You can navigate through the pages in the report by either clicking on the pages listed below, or by using the keyword search tool below to find specific information within the annual report.-
 1
1 -
 2
2 -
 3
3 -
 4
4 -
 5
5 -
 6
6 -
 7
7 -
 8
8 -
 9
9 -
 10
10 -
 11
11 -
 12
12 -
 13
13 -
 14
14 -
 15
15 -
16
-
17
-
18
-
19
-
20
-
21
-
22
-
23
-
24
-
25
-
26
-
27
-
28
-
29
-
30
-
31
-
32
-
33
-
34
-
35
-
36
-
37
-
38
-
39
-
40
-
41
-
42
-
43
-
44
-
45
-
46
-
47
-
48
-
49
-
50
-
51
-
52
-
53
-
54
-
55
-
56
-
57
-
58
-
59
-
60
-
61
-
62
-
63
-
64
-
65
-
66
-
67
-
68
-
69
-
70
-
71
-
72
-
73
-
74
-
75
-
76
-
77
-
78
-
79
-
80
-
81
-
82
-
83
-
84
-
85
-
86
-
87
-
88
-
89
-
90
-
91
-
92
-
93
-
94
-
95
-
96
-
97
-
98
-
99
-
100
-
101
-
102
-
103
-
104
-
105
-
106
-
107
-
108
-
109
-
110
-
111
-
112
-
113
-
114
-
115
-
116
-
117
-
118
-
119
-
120
-
121
-
122
-
123
-
124
-
125
-
126
-
127
-
128
-
129
-
130
-
131
-
132
-
133
-
134
-
135
-
136
-
137
-
138
-
139
-
140
-
141
-
142
-
143
-
144
-
145
-
146
-
147
-
148
-
149
-
150
-
151
-
152
-
153
-
154
-
155
-
156
 |
 |
Financial Highlights
2|Highlights
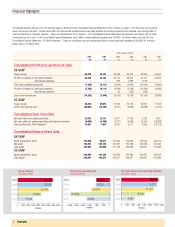
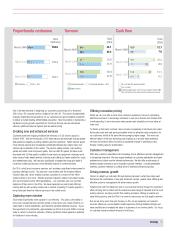
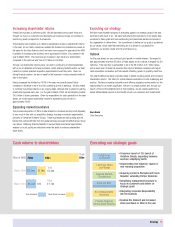
Group Turnover
Year ended 31 March
Total Group operating loss
Year ended 31 March
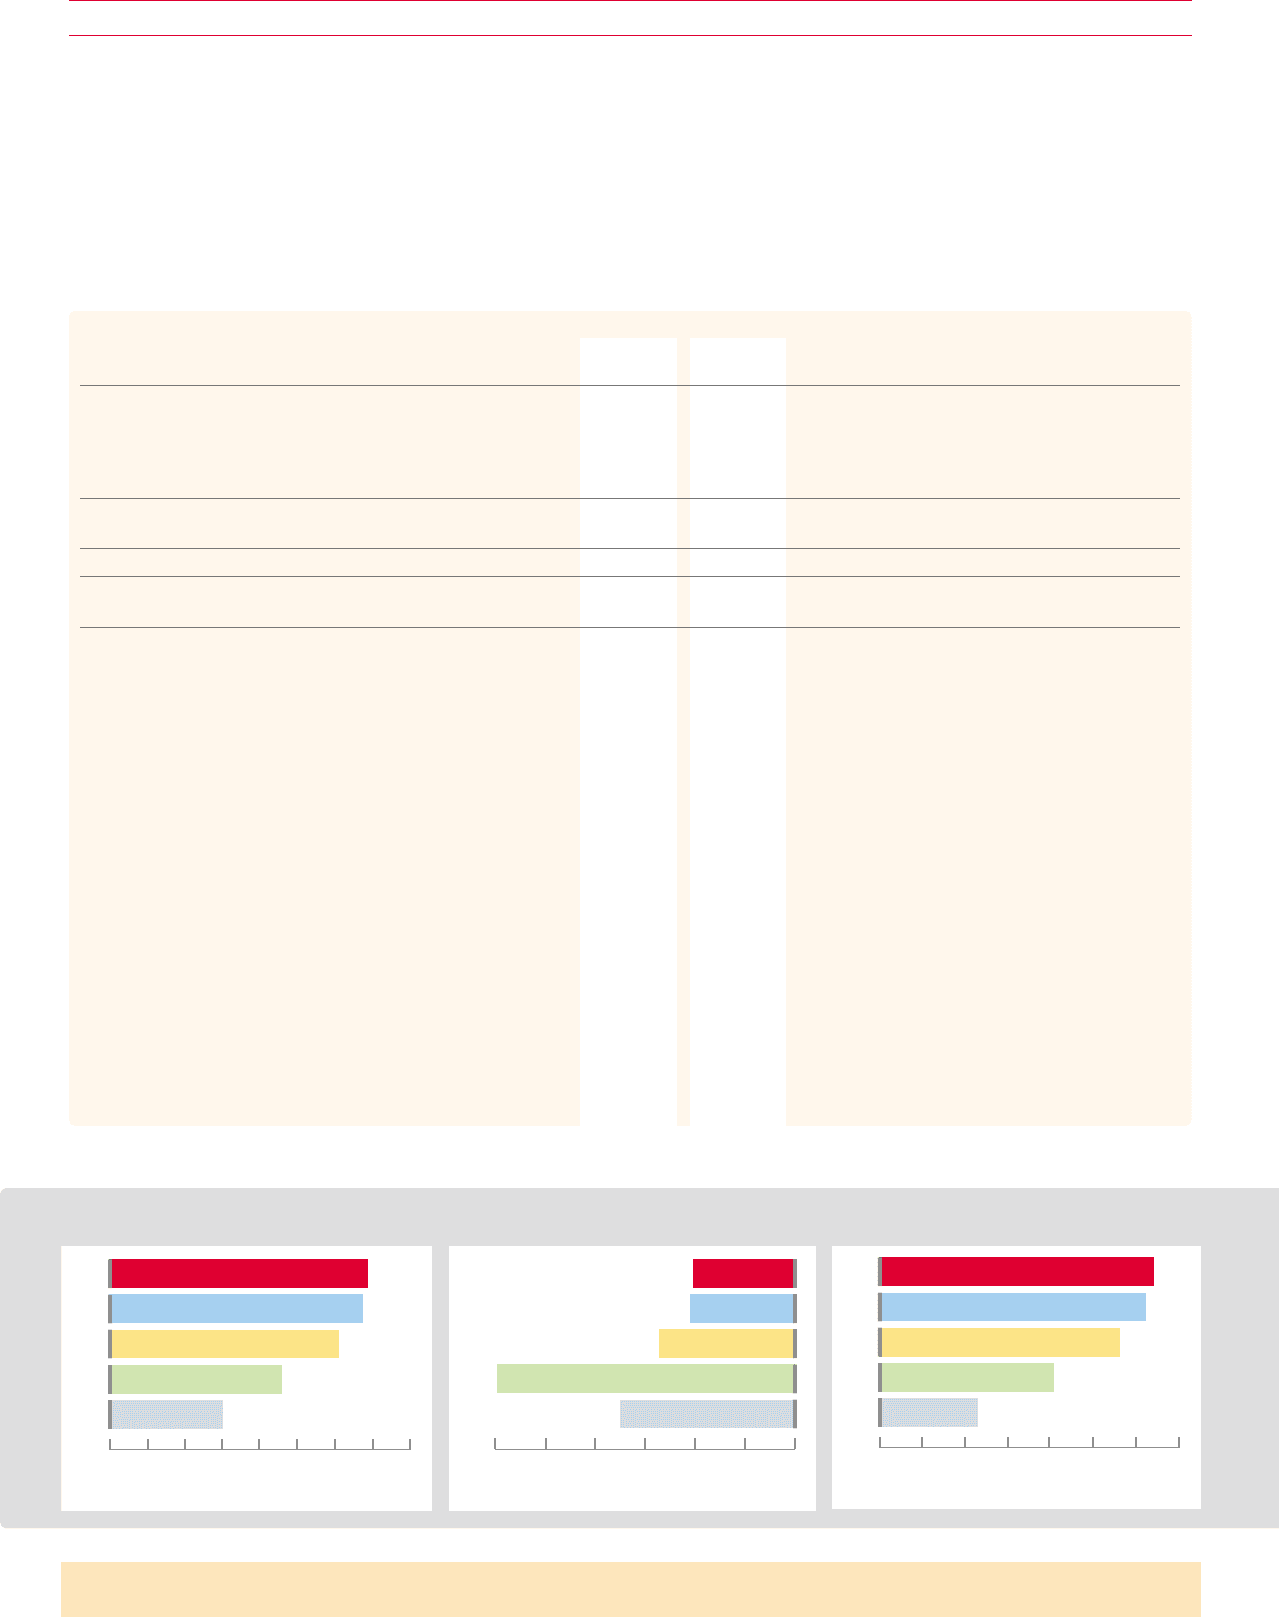
Net cash inflow from operating activities
Year ended 31 March
The selected financial data set out on the following pages is derived from the Consolidated Financial Statements of the Company on pages 77 to 136 and as such should be
read in conjunction with them. Certain trends within the financial data presented below have been impacted by business acquisitions and disposals, the most significant of
which are described in “Business Overview – History and Development of the Company”. The Consolidated Financial Statements are prepared in accordance with UK GAAP,
on the basis set out in note 1 to the Consolidated Financial Statements, which differ in certain significant respects from US GAAP. For further details, see note 36 to the
Consolidated Financial Statements, “US GAAP information”. Solely for convenience, amounts represented below in dollars have been translated at $1.8888: £1, the Noon
Buying Rate on 31 March 2005.
At/year ended 31 March
2005 2005 2004 2003 2002 2001
$m £m £m £m £m £m
Consolidated Profit and Loss Account Data
UK GAAP
Group turnover 64,470 34,133 33,559 30,375 22,845 15,004
Of which in respect of: continuing operations 64,470 34,133 32,741 28,547 21,767 15,004
discontinued operations ––818 1,828 1,078 –
Total Group operating (loss)/profit (7,765) (4,111) (4,230) (5,451) (11,834) (6,989)
Of which in respect of: continuing operations (7,765) (4,111) (4,296) (5,208) (11,408) (6,989)
discontinued operations ––66 (243) (426) –
Loss for the financial year (14,242) (7,540) (9,015) (9,819) (16,155) (9,885)
US GAAP
Group turnover 56,424 29,873 27,653 22,416 16,561 11,103
Loss for the financial year(1)(2) (26,031) (13,782) (8,127) (9,055) (16,688) (7,071)
Consolidated Cash Flow Data
Net cash inflow from operating activities 24,012 12,713 12,317 11,142 8,102 4,587
Net cash outflow for capital expenditure and financial investment (9,006) (4,768) (4,267) (5,359) (4,441) (18,988)
Free cash flow (Non-GAAP measure)(3) 14,821 7,847 8,521 5,171 2,365 (13,278)
Consolidated Balance Sheet Data
UK GAAP
Equity shareholders’ funds 187,590 99,317 111,924 128,630 130,540 144,979
Net assets 192,913 102,135 114,931 131,493 133,395 147,400
Total assets 252,922 133,906 147,129 163,239 162,867 172,362
US GAAP
Equity shareholders’ funds 202,564 107,245 125,029 140,436 140,887 155,522
Total assets(4) 348,591 184,557 213,527 234,447 205,997 214,380
(4,111)
£millions
(10,000)(12,000) (8,000) (6,000) (4,000) (2,000) 0
2005
2004
2003
2002
2001
(4,230)
(5,451)
(11,834)
(6,989)
£millions
0 5,000 10,000 15,000 20,000 25,000 30,000 35,000 40,000
2005
2004
2003
2002
2001
33,559
34,133
30,375
22,845
15,004
2005
2004
2003
2002
2001
12,317
12,713
11,142
8,102
4,587
£millions
0 2,000 4,000 6,000 8,000 10,000 12,000 14,000