Vodafone 2005 Annual Report Download - page 5
Download and view the complete annual report
Please find page 5 of the 2005 Vodafone annual report below. You can navigate through the pages in the report by either clicking on the pages listed below, or by using the keyword search tool below to find specific information within the annual report.-
 1
1 -
 2
2 -
 3
3 -
 4
4 -
 5
5 -
 6
6 -
 7
7 -
 8
8 -
 9
9 -
 10
10 -
 11
11 -
 12
12 -
 13
13 -
 14
14 -
 15
15 -
 16
16 -
17
-
18
-
19
-
20
-
21
-
22
-
23
-
24
-
25
-
26
-
27
-
28
-
29
-
30
-
31
-
32
-
33
-
34
-
35
-
36
-
37
-
38
-
39
-
40
-
41
-
42
-
43
-
44
-
45
-
46
-
47
-
48
-
49
-
50
-
51
-
52
-
53
-
54
-
55
-
56
-
57
-
58
-
59
-
60
-
61
-
62
-
63
-
64
-
65
-
66
-
67
-
68
-
69
-
70
-
71
-
72
-
73
-
74
-
75
-
76
-
77
-
78
-
79
-
80
-
81
-
82
-
83
-
84
-
85
-
86
-
87
-
88
-
89
-
90
-
91
-
92
-
93
-
94
-
95
-
96
-
97
-
98
-
99
-
100
-
101
-
102
-
103
-
104
-
105
-
106
-
107
-
108
-
109
-
110
-
111
-
112
-
113
-
114
-
115
-
116
-
117
-
118
-
119
-
120
-
121
-
122
-
123
-
124
-
125
-
126
-
127
-
128
-
129
-
130
-
131
-
132
-
133
-
134
-
135
-
136
-
137
-
138
-
139
-
140
-
141
-
142
-
143
-
144
-
145
-
146
-
147
-
148
-
149
-
150
-
151
-
152
-
153
-
154
-
155
-
156
 |
 |

Highlights |3
At/year ended 31 March
2005 2005 2004 2003 2002 2001
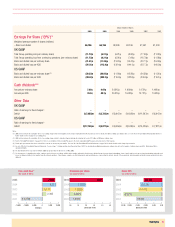
Earnings Per Share (“EPS”)(5)
Weighted average number of shares (millions)
– Basic and diluted 66,196 66,196 68,096 68,155 67,961 61,439
UK GAAP
Total Group operating loss (per ordinary share) (11.73)¢ (6.21)p (6.21)p (8.00)p (17.42)p (11.38)p
Total Group operating loss from continuing operations (per ordinary share) (11.73)¢ (6.21)p (6.31)p (7.64)p (16.79)p (11.38)p
Basic and diluted loss per ordinary share (21.51)¢ (11.39)p (13.24)p (14.41)p (23.77)p (16.09)p
Basic and diluted loss per ADS (215.1)¢ (113.9)p (132.4)p (144.1)p (237.7)p (160.9)p
US GAAP
Basic and diluted loss per ordinary share(1)(2) (39.32)¢ (20.82)p (11.93)p (13.29)p (24.56)p (11.51)p
Basic and diluted loss per ADS (393.2)¢ (208.2)p (119.3)p (132.9)p (245.6)p (115.1)p
Cash dividends(5)(6)
Amount per ordinary share 7.68¢ 4.07p 2.0315p 1.6929p 1.4721p 1.4020p
Amount per ADS 76.8¢ 40.7p 20.315p 16.929p 14.721p 14.020p
Other Data
UK GAAP
Ratio of earnings to fixed charges(7) –––– ––
Deficit $(7,055)m £(3,735)m £(3,647)m £(4,828)m £(11,267)m £(6,947)m
US GAAP
Ratio of earnings to fixed charges(7) –––– ––
Deficit $(17,145)m £(9,077)m £(9,059)m £(8,436)m £(14,425)m £(7,811)m
Notes:
(1) 2005 net loss includes the cumulative effect of accounting changes related to intangible assets and post employment benefits that increase net loss by £6,372 million or 9.63p per ordinary share. See note 36 of the Consolidated Financial Statements for
further details on these changes in accounting policy.
(2) 2002 net loss includes the cumulative effect of accounting change related to derivative financial instruments reducing net loss by £17 million or 0.02p per ordinary share.
(3) Refer to “Non-GAAP Information”on pages 52 to 54 for a reconciliation of this non-GAAP measure to the most comparable GAAP measure and a discussion of this measure.
(4) Certain prior year amounts have been reclassified to conform to current year presentation. See note 36 of the Consolidated Financial Statements on page 126 for further details on this change in presentation.
(5) See note 10 to the Consolidated Financial Statements, “Loss per share”. Earnings per American Depository Share (“ADS”) is calculated by multiplying earnings per ordinary share by ten, the number of ordinary shares per ADS. Dividend per ADS is
calculated similarly.
(6) The final dividend for the year ended 31 March 2005 was proposed by the directors on 24 May 2005.
(7) For the purposes of calculating these ratios, earnings consist of income on ordinary activities before taxation adjusted for fixed charges, dividend income from associated undertakings, share of profits and losses from associated undertakings and profits and
losses on ordinary activities before taxation from discontinued operations. Fixed charges comprise one-third of payments under operating leases, representing the interest element of these payments, interest payable and similar charges and preferred share
dividends.
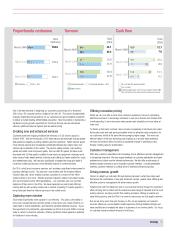
pence per share
0.0 1.0 2.0 3.0 4.0 5.0
2005
2004
2003
2002
2001
2.0315
4.07
1.6929
1.4721
1.4020
(25.00) (20.00) (15.00) (10.00) (5.00) 0.00
2005
2004
2003
2002
2001
(13.24)
(14.41)
(23.77)
(16.09)
pence per share
(11.39)
7,847
£millions
(15,000) (10,000) (5,000) 0 5,000 10,000
2005
2004
2003
2002
2001
8,521
5,171
2,365
(13,278)
Free cash flow(3)
Year ended 31 March
Dividends per share
Year ended 31 March
Basic EPS
Year ended 31 March