Vodafone 2005 Annual Report Download - page 55
Download and view the complete annual report
Please find page 55 of the 2005 Vodafone annual report below. You can navigate through the pages in the report by either clicking on the pages listed below, or by using the keyword search tool below to find specific information within the annual report.-
 1
1 -
2
-
3
-
4
-
5
-
6
-
7
-
8
-
9
-
10
-
11
-
12
-
13
-
14
-
15
-
16
-
17
-
18
-
19
-
20
-
21
-
22
-
23
-
24
-
25
-
26
-
27
-
28
-
29
-
30
-
31
-
32
-
33
-
34
-
35
-
36
-
37
-
38
-
39
-
40
-
41
-
42
-
43
-
44
-
 45
45 -
 46
46 -
 47
47 -
 48
48 -
 49
49 -
 50
50 -
 51
51 -
 52
52 -
 53
53 -
 54
54 -
 55
55 -
 56
56 -
 57
57 -
 58
58 -
 59
59 -
 60
60 -
 61
61 -
 62
62 -
 63
63 -
 64
64 -
 65
65 -
66
-
67
-
68
-
69
-
70
-
71
-
72
-
73
-
74
-
75
-
76
-
77
-
78
-
79
-
80
-
81
-
82
-
83
-
84
-
85
-
86
-
87
-
88
-
89
-
90
-
91
-
92
-
93
-
94
-
95
-
96
-
97
-
98
-
99
-
100
-
101
-
102
-
103
-
104
-
105
-
106
-
107
-
108
-
109
-
110
-
111
-
112
-
113
-
114
-
115
-
116
-
117
-
118
-
119
-
120
-
121
-
122
-
123
-
124
-
125
-
126
-
127
-
128
-
129
-
130
-
131
-
132
-
133
-
134
-
135
-
136
-
137
-
138
-
139
-
140
-
141
-
142
-
143
-
144
-
145
-
146
-
147
-
148
-
149
-
150
-
151
-
152
-
153
-
154
-
155
-
156
 |
 |

Performance |53
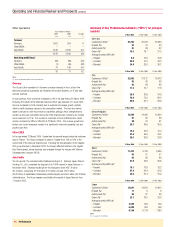
Impact of Reported growth Impact of goodwill Reported growth
Organic Impact of acquisitions in non-GAAP amortisation and in equivalent
growth foreign exchange and disposals measure exceptional items GAAP measure(2)
%%%%%%
Total Group operating loss
Mobile telecommunications operating profit(1) 4 (3) –1 (4) (3)
Total Group operating profit(1) 5 (3) (1) 1 (4) (3)
Notes
(1) Before goodwill amortisation and exceptional items
(2) Closest equivalent GAAP measure is Total Group operating loss
Presentation of measures before goodwill amortisation and exceptional items
The Group presents operating profit before goodwill amortisation and exceptional operating items for the Group and the Group’s reported business segments, being mobile
telecommunications and other operations. The Group believes that it is both useful and necessary to report these measures for the following reasons:
•these measures are used by the Group for internal performance analysis;
•the presentation by the Group’s reported business segments of these measures facilitates comparability with other companies, although the Group’s measures may not be
comparable with similarly titled profit measurements reported by other companies; and
•it is useful in connection with discussion with the investment analyst community and debt rating agencies.
Reconciliation of these measures to the closest equivalent GAAP measure, Total Group operating loss, is provided in note 3 to the Consolidated Financial Statements.
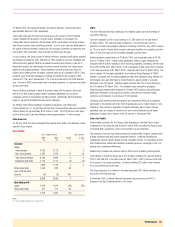
Presentation of other revenue in discussion of trading results
The discussion of the trading results of the Group and principal markets on pages 33 to 44 presents the cost of sales related to acquisition and retention costs net of revenue
attributable to these activities. The Group believes that this basis of presentation provides useful information for investors for the following reasons:
•it provides trends in net subsidies with respect to the acquisition and retention of customers; and
•it facilitates comparability of results with other companies operating in the mobile telecommunications business. This performance indicator is commonly used in the mobile
telecommunications industry and by Vodafone management to compare net subsidies provided to acquire and retain customers to prior periods and internal forecasts. “Net
other revenue”, “Net acquisition costs”and “Net retention costs”as used in the trading results are defined on page 29.
Reconciliation of “Net other revenue”to the closest equivalent GAAP measure, turnover, and “Net acquisition costs”and “Net retention costs”to their closest equivalent GAAP
measure, gross acquisition and retention costs, are shown below:
Mobile
telecommunications Germany Italy UK Spain Japan
£m £m £m £m £m £m
Year ended 31 March 2005:
Net other revenue 557 122 19 177 2 21
Acquisition and retention revenue 3,305 242 218 390 296 1,765
Other revenue 3,862 364 237 567 298 1,786
Total service revenue 29,322 5,320 5,328 4,498 2,963 5,610
Turnover 33,184 5,684 5,565 5,065 3,261 7,396
Year ended 31 March 2004:
Net other revenue 512 155 13 146 3 20
Acquisition and retention revenue 3,154 232 250 440 210 1,690
Other revenue 3,666 387 263 586 213 1,710
Total service revenue 28,249 5,149 5,049 4,196 2,473 6,140
Turnover 31,915 5,536 5,312 4,782 2,686 7,850