Vodafone 2005 Annual Report Download - page 48
Download and view the complete annual report
Please find page 48 of the 2005 Vodafone annual report below. You can navigate through the pages in the report by either clicking on the pages listed below, or by using the keyword search tool below to find specific information within the annual report.-
 1
1 -
2
-
3
-
4
-
5
-
6
-
7
-
8
-
9
-
10
-
11
-
12
-
13
-
14
-
15
-
16
-
17
-
18
-
19
-
20
-
21
-
22
-
23
-
24
-
25
-
26
-
27
-
28
-
29
-
30
-
31
-
32
-
33
-
34
-
35
-
36
-
37
-
 38
38 -
 39
39 -
 40
40 -
 41
41 -
 42
42 -
 43
43 -
 44
44 -
 45
45 -
 46
46 -
 47
47 -
 48
48 -
 49
49 -
 50
50 -
 51
51 -
 52
52 -
 53
53 -
 54
54 -
 55
55 -
 56
56 -
 57
57 -
 58
58 -
59
-
60
-
61
-
62
-
63
-
64
-
65
-
66
-
67
-
68
-
69
-
70
-
71
-
72
-
73
-
74
-
75
-
76
-
77
-
78
-
79
-
80
-
81
-
82
-
83
-
84
-
85
-
86
-
87
-
88
-
89
-
90
-
91
-
92
-
93
-
94
-
95
-
96
-
97
-
98
-
99
-
100
-
101
-
102
-
103
-
104
-
105
-
106
-
107
-
108
-
109
-
110
-
111
-
112
-
113
-
114
-
115
-
116
-
117
-
118
-
119
-
120
-
121
-
122
-
123
-
124
-
125
-
126
-
127
-
128
-
129
-
130
-
131
-
132
-
133
-
134
-
135
-
136
-
137
-
138
-
139
-
140
-
141
-
142
-
143
-
144
-
145
-
146
-
147
-
148
-
149
-
150
-
151
-
152
-
153
-
154
-
155
-
156
 |
 |
Operating and Financial Review and Prospects continued
46 |Performance
In the year ended 31 March 2005, revenue from continuing operations under US GAAP
was £29,873 million compared with revenue from continuing operations under UK
GAAP of £34,133 million for the same period. The difference relates to the non-
consolidation of Vodafone Italy as a result of the existence of significant participating
rights of a minority shareholder requiring the equity method of accounting to be
adopted under US GAAP rather than the full consolidation of results under UK GAAP,
offset by the release of connection revenue deferred prior to the adoption of
EITF 00-21 on 1 October 2003, which is required to be recognised over the period a
customer is expected to remain connected to the network under US GAAP.
Net loss under US GAAP for the year ended 31 March 2005 was £13,782 million,
compared with a net loss under UK GAAP of £7,540 million for the same period. The
higher net loss under US GAAP was mainly driven by changes in accounting policy and
higher amortisation charges, partially offset by income taxes and equity in earnings of
equity method investments.
The reconciliation of the differences between UK GAAP and US GAAP is provided in
note 36 to the Consolidated Financial Statements.
On 29 September 2004, the Staff of the SEC announced new guidance on the
interpretation of US GAAP in relation to accounting for intangible assets. Further details
on the guidance and its impact on the Group are provided on page 132.
Liquidity and Capital Resources
Cash flows
The major sources of Group liquidity for the 2005 financial year have been cash
generated from operations and dividends from associated undertakings. For the year
ended 31 March 2004, sources of Group liquidity also included borrowings through
long term issuance in the capital markets and asset disposals. The Group does not
use off-balance sheet special purpose entities as a source of liquidity or for other
financing purposes.
The Group’s key sources of liquidity for the foreseeable future are likely to be cash
generated from operations and borrowings through long term and short term
issuances in the capital markets, as well as committed bank facilities. Additionally, the
Group has a put option in relation to its interest in Verizon Wireless which, if exercised,
could provide a material cash inflow. Please see “Option agreements”at the end of
this section.
The Group’s liquidity and working capital may be affected by a material decrease in
cash flow due to factors such as increased competition, litigation, timing of tax
payments and the resolution of outstanding tax issues, regulatory rulings, delays in
development of new services and networks, inability to receive expected revenue from
the introduction of new services, reduced dividends from associates and investments or
dividend payments to minority shareholders. Please see “Risk Factors”, above. The
Group is also party to a number of agreements that may result in a cash outflow in
future periods. These agreements are discussed further in “Option agreements”at the
end of this section.
Wherever possible, surplus funds in the Group (except in Albania and Egypt) are
transferred to the centralised treasury department through repayment of borrowings,
deposits and dividends. These are then on-lent or contributed as equity to fund Group
operations, used to retire external debt or invested externally.
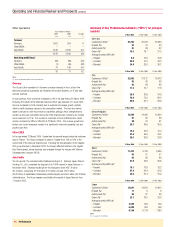
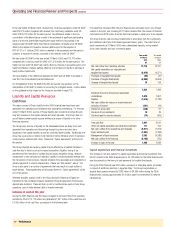
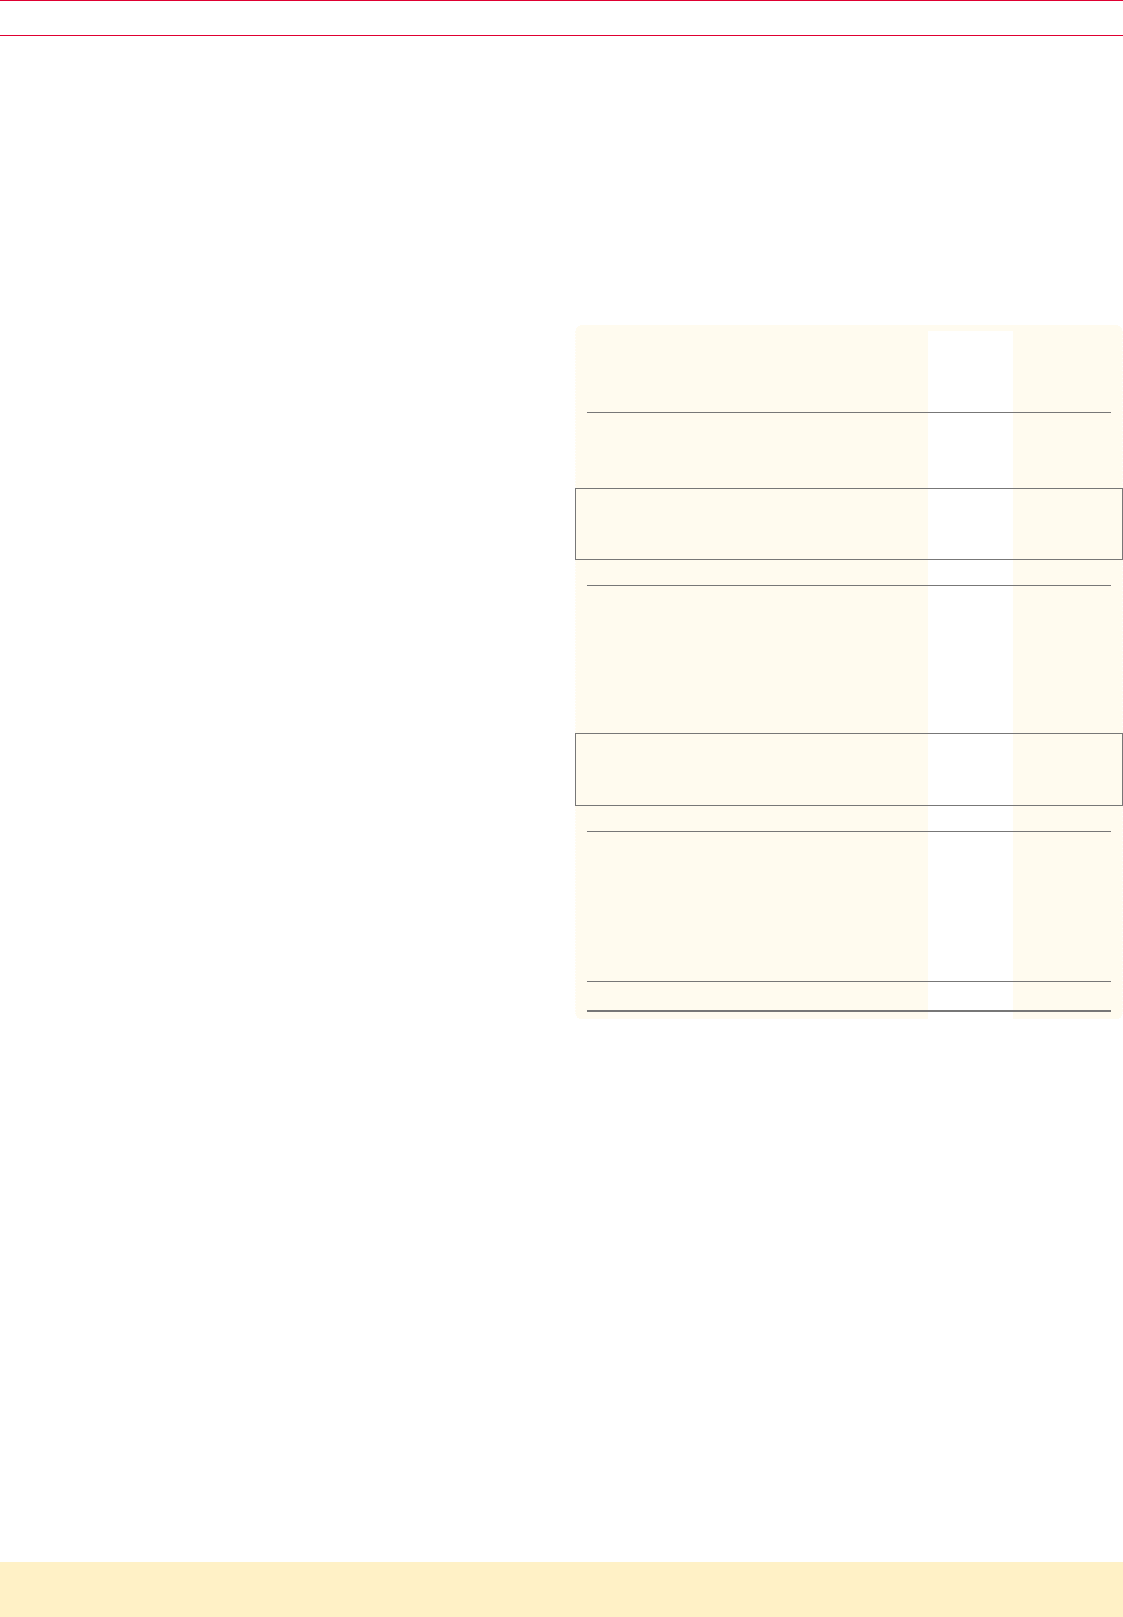
Increase in cash in the year
During the 2005 financial year, the Group increased its net cash inflow from operating
activities by 3% to £12,713 million and generated £7,847 million of free cash flow and
£1,405 million of net cash flow, as analysed in the following table.
Free cash flow decreased from the prior financial year principally due to one-off cash
receipts in the prior year, including £572 million received from the closure of financial
instruments and £198 million from the fixed line business in Japan prior to its disposal.
The Group holds its cash and liquid investments in accordance with the counterparty
and settlement risk limits of the Board approved treasury policy. The main forms of
liquid investments at 31 March 2005 were collateralised deposits, money market
funds, bank deposits and euro commercial paper.
Year ended Year ended
31 March 31 March
2005 2004
£m £m
Net cash inflow from operating activities 12,713 12,317
Net capital expenditure on intangible and
tangible fixed assets (4,879) (4,371)
Purchase of intangible fixed assets (59) (21)
Purchase of tangible fixed assets (4,890) (4,508)
Disposal of tangible fixed assets 70 158
7,834 7,946
Dividends from joint ventures and associated
undertakings 2,020 1,801
Taxation (1,616) (1,182)
Net cash outflow for returns on investments and
servicing of finance (391) (44)
Interest on group debt (336) 31
Dividends from investments 19 25
Dividends paid to minority interests (74) (100)
Free cash flow 7,847 8,521
Other net capital expenditure and financial investment 111 104
Net cash outflow from acquisitions and disposals (2,017) (1,312)
Equity dividends paid (1,991) (1,258)
Management of liquid resources 3,563 (4,286)
Net cash outflow from financing (6,108) (700)
Increase in cash in the year 1,405 1,069
Capital expenditure and financial investment
The increase in net cash outflow for capital expenditure and financial investment from
£4,267 million for the 2004 financial year to £4,768 million for the 2005 financial year
was due primarily to the timing of cash payments for tangible fixed assets.
During the 2005 financial year, £59 million was spent on intangible assets, principally
in respect of additional spectrum in Egypt and Italy. The Group’s expenditure on
tangible fixed assets increased by £382 million to £4,890 million during the 2005
financial year, including approximately £1.6 billion spent on incremental 3G network
infrastructure.