United Airlines 2008 Annual Report Download - page 76
Download and view the complete annual report
Please find page 76 of the 2008 United Airlines annual report below. You can navigate through the pages in the report by either clicking on the pages listed below, or by using the keyword search tool below to find specific information within the annual report.-
 1
1 -
2
-
3
-
4
-
5
-
6
-
7
-
8
-
9
-
10
-
11
-
12
-
13
-
14
-
15
-
16
-
17
-
18
-
19
-
20
-
21
-
22
-
23
-
24
-
25
-
26
-
27
-
28
-
29
-
30
-
31
-
32
-
33
-
34
-
35
-
36
-
37
-
38
-
39
-
40
-
41
-
42
-
43
-
44
-
45
-
46
-
47
-
48
-
49
-
50
-
51
-
52
-
53
-
54
-
55
-
56
-
57
-
58
-
59
-
60
-
61
-
62
-
63
-
64
-
65
-
 66
66 -
 67
67 -
 68
68 -
 69
69 -
 70
70 -
 71
71 -
 72
72 -
 73
73 -
 74
74 -
 75
75 -
 76
76 -
 77
77 -
 78
78 -
 79
79 -
 80
80 -
 81
81 -
 82
82 -
 83
83 -
 84
84 -
 85
85 -
 86
86 -
87
-
88
-
89
-
90
-
91
-
92
-
93
-
94
-
95
-
96
-
97
-
98
-
99
-
100
-
101
-
102
-
103
-
104
-
105
-
106
-
107
-
108
-
109
-
110
-
111
-
112
-
113
-
114
-
115
-
116
-
117
-
118
-
119
-
120
-
121
-
122
-
123
-
124
-
125
-
126
-
127
-
128
-
129
-
130
-
131
-
132
-
133
-
134
-
135
-
136
-
137
-
138
-
139
-
140
-
141
-
142
-
143
-
144
-
145
-
146
-
147
-
148
-
149
-
150
-
151
-
152
-
153
-
154
-
155
-
156
-
157
-
158
-
159
 |
 |

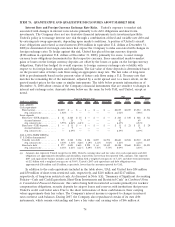
(a) Percent of expected consumption represents the notional amount of the purchased calls in the hedge structures. Certain
3-way collars and collars included in the table above have sold puts with twice the notional amount of the purchased calls.
The percentages in parentheses represent the notional amount of sold puts in these hedge structures.
(b) Call position average includes the following two groupings of positions: 6% of consumption with protection beginning at $47
per barrel and 8% of consumption beginning at $106 per barrel.
(c) Call position average includes the following two groupings of positions: 4% of consumption with protection beginning at $50
per barrel and 5% of consumption beginning at $106 per barrel.
As presented in the table above, in 2008 the Company began modifying its fuel hedge portfolio by
purchasing put options contracts to effectively cap losses on its short put option positions from further
oil price decreases. The Company may take additional actions to reduce potential losses and collateral
requirements that could arise from its short put option positions. Certain 3-way collars and collars
included in the table above have sold puts with twice the notional amount of the purchased calls. The
Company’s exposure to losses, should the positions settle below the put exercise price, exceeds its
potential benefit from price increases above the purchased call exercise price. The Company classifies
gains (losses) resulting from these collar structures as nonoperating income (expense). As of
December 31, 2008, the Company had hedged less than 1% of its 2010 forecasted fuel consumption.
The above derivative positions are subject to potential counterparty cash collateral requirements in
some circumstances. The Company provided counterparties with cash collateral of $965 million as of
December 31, 2008. This collateral decreased to $780 million as of January 19, 2009 primarily due to the
settlement of the December 2008 contracts. Our counterparties may require greater amounts of
collateral when the price of the underlying commodity decreases and lesser amounts when the price of
the underlying commodity increases. However, the Company has mitigated some of its exposure to larger
collateral requirements by purchasing puts to cover its short put positions as presented in the table
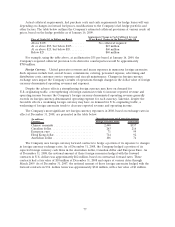
above. The following table presents the Company’s actual collateral position as of January 19, 2009 and
estimated fuel collateral position at the end of each quarter in 2009 based on the Company’s January 16,
2009 hedge positions and closing forward curve fuel prices:
(In millions)
Actual
January 19,
2009
March 31,
2009
June 30,
2009
September 30,
2009
December 31,
2009
Projected
$780 $615 $315 $110 $25
Because United had already posted significant amounts of collateral during 2008, the 2009 net cash
impacts of the hedge settlements are not expected to be material based on January 16, 2009 forward
curve prices and the Company’s January 16, 2009 hedge position. As hedges settle, this collateral will be
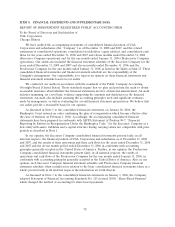
returned to cover cash settled losses. The following table presents information regarding estimated fuel
purchase cost and estimated cash requirements to meet fuel hedge losses based on the Company’s actual
collateral position as of January 19, 2009 using closing forward fuel prices as of January 16, 2009 and
other factors.
(Price per gallon) 1st Quarter 2nd Quarter 3rd Quarter 4th Quarter Full Year
2009
Unhedged fuel cost(a) ................ $1.73 $1.79 $1.89 $1.91 $1.83
Cash hedge losses(b) ................. 0.49 0.39 0.26 0.09 0.31
(In millions)
Cash hedge losses classified in
nonoperating expense(c)............. $ 81 $111 $ 53 $ 52 $297
(a) Per gallon amount based on assumed cash requirements for fuel purchases, including related taxes and transportation costs
(b) Per gallon amount based on assumed cash requirements for settlement of economic hedge contracts that have gains or losses
classified within mainline fuel expense.
(c) Assumed cash requirements for settlement of hedge contracts that are classified in nonoperating expense.
76