United Airlines 2008 Annual Report Download - page 110
Download and view the complete annual report
Please find page 110 of the 2008 United Airlines annual report below. You can navigate through the pages in the report by either clicking on the pages listed below, or by using the keyword search tool below to find specific information within the annual report.-
 1
1 -
2
-
3
-
4
-
5
-
6
-
7
-
8
-
9
-
10
-
11
-
12
-
13
-
14
-
15
-
16
-
17
-
18
-
19
-
20
-
21
-
22
-
23
-
24
-
25
-
26
-
27
-
28
-
29
-
30
-
31
-
32
-
33
-
34
-
35
-
36
-
37
-
38
-
39
-
40
-
41
-
42
-
43
-
44
-
45
-
46
-
47
-
48
-
49
-
50
-
51
-
52
-
53
-
54
-
55
-
56
-
57
-
58
-
59
-
60
-
61
-
62
-
63
-
64
-
65
-
66
-
67
-
68
-
69
-
70
-
71
-
72
-
73
-
74
-
75
-
76
-
77
-
78
-
79
-
80
-
81
-
82
-
83
-
84
-
85
-
86
-
87
-
88
-
89
-
90
-
91
-
92
-
93
-
94
-
95
-
96
-
97
-
98
-
99
-
 100
100 -
 101
101 -
 102
102 -
 103
103 -
 104
104 -
 105
105 -
 106
106 -
 107
107 -
 108
108 -
 109
109 -
 110
110 -
 111
111 -
 112
112 -
 113
113 -
 114
114 -
 115
115 -
 116
116 -
 117
117 -
 118
118 -
 119
119 -
 120
120 -
121
-
122
-
123
-
124
-
125
-
126
-
127
-
128
-
129
-
130
-
131
-
132
-
133
-
134
-
135
-
136
-
137
-
138
-
139
-
140
-
141
-
142
-
143
-
144
-
145
-
146
-
147
-
148
-
149
-
150
-
151
-
152
-
153
-
154
-
155
-
156
-
157
-
158
-
159
 |
 |

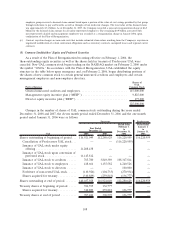
UAL 2008 2007
Period from
February 1
to
December 31,
2006
Period from
January 1
to
January 31,
2006
(In millions, except per share)
Year Ended
December 31,
Successor Predecessor
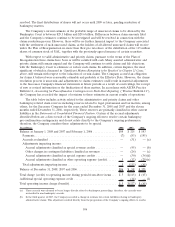
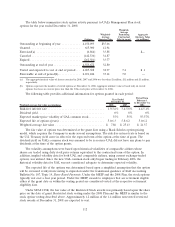
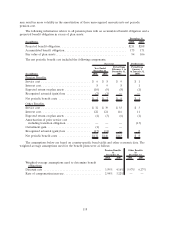
Basic earnings per share:
Net income (loss) . . . . . . . . . . . . . . . . . . . . . . . . . . . . . . . . . . . . $(5,348) $ 403 $ 25 $22,851
Preferred stock dividend requirements . . . . . . . . . . . . . . . . . . . . . (3) (10) (9) (1)
Earnings (loss) available to common stockholders . . . . . . . . . . . . . $(5,351) $ 393 $ 16 $22,850
Basic weighted-average shares outstanding . . . . . . . . . . . . . . . . . . 126.8 117.4 115.5 116.2
Earnings (loss) per share, basic . . . . . . . . . . . . . . . . . . . . . . . . . . $(42.21) $ 3.34 $ 0.14 $196.61
Diluted earnings per share:
Earnings (loss) available to common stockholders . . . . . . . . . . . . . $(5,351) $ 393 $ 16 $22,850
Effect of 2% preferred securities . . . . . . . . . . . . . . . . . . . . . . . . . — 10 — —
Effect of 4.5% senior limited-subordination convertible notes . . . . — 20 — —
Effect of 5% convertible notes. . . . . . . . . . . . . . . . . . . . . . . . . . . — 5 — —
Earnings available to common stockholders including the effect of
dilutive securities . . . . . . . . . . . . . . . . . . . . . . . . . . . . . . . . . . $(5,351) $ 428 $ 16 $22,850
Basic weighted-average shares outstanding . . . . . . . . . . . . . . . . . . 126.8 117.4 115.5 116.2
Effect of non-vested stock options . . . . . . . . . . . . . . . . . . . . . . . . — 0.2 — —
Effect of non-vested restricted shares . . . . . . . . . . . . . . . . . . . . . . — 1.1 0.7 —
Effect of 2% preferred securities . . . . . . . . . . . . . . . . . . . . . . . . . — 11.0 — —
Effect of 4.5% senior limited-subordination convertible notes . . . . — 20.8 — —
Effect of 5% convertible notes. . . . . . . . . . . . . . . . . . . . . . . . . . . — 3.2 — —
Diluted weighted-average shares outstanding . . . . . . . . . . . . . . . . 126.8 153.7 116.2 116.2
Earnings (loss) per share, diluted . . . . . . . . . . . . . . . . . . . . . . . . $(42.21) $ 2.79 $ 0.14 $196.61
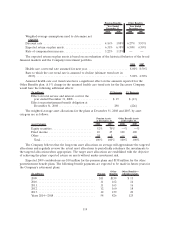
Potentially dilutive shares excluded from diluted per share amounts:
Stock options . . . . . . . . . . . . . . . . . . . . . . . . . . . . . . . . . . . . . . . . 4.4 4.0 5.0 9.0
Restricted shares . . . . . . . . . . . . . . . . . . . . . . . . . . . . . . . . . . . . . . 1.4 0.9 2.0 —
2% preferred securities . . . . . . . . . . . . . . . . . . . . . . . . . . . . . . . . . 3.1 — 10.8 —
4.5% senior limited-subordination convertible notes . . . . . . . . . . . . . 22.2 — 20.8 —
5% convertible notes . . . . . . . . . . . . . . . . . . . . . . . . . . . . . . . . . . . 3.4 — 3.2 —
34.5 4.9 41.8 9.0
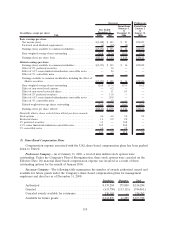
(7) Share-Based Compensation Plans
Compensation expense associated with the UAL share-based compensation plans has been pushed
down to United.
Predecessor Company—As of January 31, 2006, a total of nine million stock options were
outstanding. Under the Company’s Plan of Reorganization, these stock options were canceled on the
Effective Date. No material share-based compensation expense was incurred as a result of these
outstanding options for the month of January 2006.
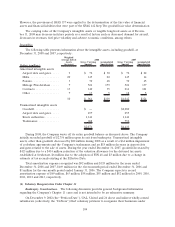
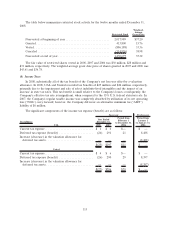
Successor Company—The following table summarizes the number of awards authorized, issued and
available for future grants under the Company’s share-based compensation plans for management
employees and directors as of December 31, 2008:
Employees Directors Total
Authorized ...................................... 8,339,284 175,000 8,514,284
Granted......................................... (633,750) (113,111) (746,861)
Canceled awards available for reissuance ............... 336,365 — 336,365
Available for future grants .......................... 8,041,899 61,889 8,103,788
110