United Airlines 2008 Annual Report Download - page 132
Download and view the complete annual report
Please find page 132 of the 2008 United Airlines annual report below. You can navigate through the pages in the report by either clicking on the pages listed below, or by using the keyword search tool below to find specific information within the annual report.-
 1
1 -
2
-
3
-
4
-
5
-
6
-
7
-
8
-
9
-
10
-
11
-
12
-
13
-
14
-
15
-
16
-
17
-
18
-
19
-
20
-
21
-
22
-
23
-
24
-
25
-
26
-
27
-
28
-
29
-
30
-
31
-
32
-
33
-
34
-
35
-
36
-
37
-
38
-
39
-
40
-
41
-
42
-
43
-
44
-
45
-
46
-
47
-
48
-
49
-
50
-
51
-
52
-
53
-
54
-
55
-
56
-
57
-
58
-
59
-
60
-
61
-
62
-
63
-
64
-
65
-
66
-
67
-
68
-
69
-
70
-
71
-
72
-
73
-
74
-
75
-
76
-
77
-
78
-
79
-
80
-
81
-
82
-
83
-
84
-
85
-
86
-
87
-
88
-
89
-
90
-
91
-
92
-
93
-
94
-
95
-
96
-
97
-
98
-
99
-
100
-
101
-
102
-
103
-
104
-
105
-
106
-
107
-
108
-
109
-
110
-
111
-
112
-
113
-
114
-
115
-
116
-
117
-
118
-
119
-
120
-
121
-
 122
122 -
 123
123 -
 124
124 -
 125
125 -
 126
126 -
 127
127 -
 128
128 -
 129
129 -
 130
130 -
 131
131 -
 132
132 -
 133
133 -
 134
134 -
 135
135 -
 136
136 -
 137
137 -
 138
138 -
 139
139 -
 140
140 -
 141
141 -
 142
142 -
143
-
144
-
145
-
146
-
147
-
148
-
149
-
150
-
151
-
152
-
153
-
154
-
155
-
156
-
157
-
158
-
159
 |
 |

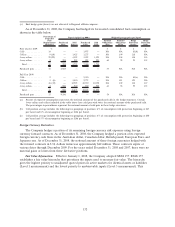
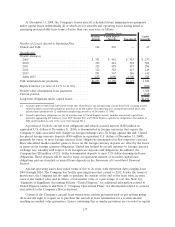
(a) Fuel hedge gains (losses) are not allocated to Regional affiliates expense.
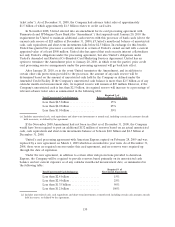
As of December 31, 2008, the Company had hedged its forecasted consolidated fuel consumption as
shown in the table below.
Percentage of
Projected
Fuel
Requirements
Hedged(a)
Purchased
Puts
Sold
Puts(a)
Purchased
Calls
Sold
Calls
Payment
Obligations
Stop
Payment
Obligations
Begin
Hedge
Protection
Begins
Hedge
Protection
Ends
Barrels hedged (in 000s) Weighted-average price per barrel
First Quarter 2009: % $ $ $ $
Calls ............ 14 — — 1,975 — NA NA 83(b) NA
Collars ........... 9(10) — 1,425 1,275 — NA 109 118 NA
3-way collars ....... 25(29) — 4,125 3,525 3,525 NA 104 118 143
4-way collars ....... 2 225 225 225 225 63 78 95 135
Total........... 50 225 5,775 7,000 3,750
Purchasedputs ..... 35 4,925 — — — 57 NA NA NA
Full Year 2009:
Calls ............ 9 — — 5,350 — NA NA 81(c) NA
Collars ........... 5 (6) — 3,450 2,775 — NA 111 123 NA
3-way collars ....... 18(22) — 12,525 10,350 10,350 NA 102 118 147
4-way collars ....... 2 900 900 900 900 63 78 95 135
Total........... 34 900 16,875 19,375 11,250
Purchasedputs ..... 17 9,500 — — — 54 NA NA NA
(a) Percent of expected consumption represents the notional amount of the purchased calls in the hedge structures. Certain
3-way collars and collars included in the table above have sold puts with twice the notional amount of the purchased calls.
The percentages in parentheses represent the notional amount of sold puts in these hedge structures.
(b) Call position average includes the following two groupings of positions: 6% of consumption with protection beginning at $47
per barrel and 8% of consumption beginning at $106 per barrel.
(c) Call position average includes the following two groupings of positions: 4% of consumption with protection beginning at $50
per barrel and 5% of consumption beginning at $106 per barrel.
Foreign Currency Derivatives.
The Company hedges a portion of its remaining foreign currency risk exposure using foreign
currency forward contracts. As of December 31, 2008, the Company hedged a portion of its expected
foreign currency cash flows in the Australian dollar, Canadian dollar, British pound, European Euro and
Japanese yen. As of December 31, 2008, the notional amount of these foreign currencies hedged with
the forward contracts in U.S. dollars terms was approximately $62 million. These contracts expire at
various dates through December 2009. For the years ended December 31, 2008 and 2007, there were no
material gains or losses from these derivative positions.
Fair Value Information. Effective January 1, 2008, the Company adopted SFAS 157. SFAS 157
establishes a fair value hierarchy that prioritizes the inputs used to measure fair value. The hierarchy
gives the highest priority to unadjusted quoted prices in active markets for identical assets or liabilities
(Level 1 measurement) and the lowest priority to unobservable inputs (Level 3 measurement). This
132