United Airlines 2008 Annual Report Download - page 53
Download and view the complete annual report
Please find page 53 of the 2008 United Airlines annual report below. You can navigate through the pages in the report by either clicking on the pages listed below, or by using the keyword search tool below to find specific information within the annual report.-
 1
1 -
2
-
3
-
4
-
5
-
6
-
7
-
8
-
9
-
10
-
11
-
12
-
13
-
14
-
15
-
16
-
17
-
18
-
19
-
20
-
21
-
22
-
23
-
24
-
25
-
26
-
27
-
28
-
29
-
30
-
31
-
32
-
33
-
34
-
35
-
36
-
37
-
38
-
39
-
40
-
41
-
42
-
 43
43 -
 44
44 -
 45
45 -
 46
46 -
 47
47 -
 48
48 -
 49
49 -
 50
50 -
 51
51 -
 52
52 -
 53
53 -
 54
54 -
 55
55 -
 56
56 -
 57
57 -
 58
58 -
 59
59 -
 60
60 -
 61
61 -
 62
62 -
 63
63 -
64
-
65
-
66
-
67
-
68
-
69
-
70
-
71
-
72
-
73
-
74
-
75
-
76
-
77
-
78
-
79
-
80
-
81
-
82
-
83
-
84
-
85
-
86
-
87
-
88
-
89
-
90
-
91
-
92
-
93
-
94
-
95
-
96
-
97
-
98
-
99
-
100
-
101
-
102
-
103
-
104
-
105
-
106
-
107
-
108
-
109
-
110
-
111
-
112
-
113
-
114
-
115
-
116
-
117
-
118
-
119
-
120
-
121
-
122
-
123
-
124
-
125
-
126
-
127
-
128
-
129
-
130
-
131
-
132
-
133
-
134
-
135
-
136
-
137
-
138
-
139
-
140
-
141
-
142
-
143
-
144
-
145
-
146
-
147
-
148
-
149
-
150
-
151
-
152
-
153
-
154
-
155
-
156
-
157
-
158
-
159
 |
 |

The decrease in cost of sales in 2007 as compared to 2006 was primarily due to lower UAFC third
party fuel sales of $307 million as described in the discussion of revenue variances above.
Special items of $44 million in the year ended December 31, 2007 include a $30 million benefit due
to the reduction in recorded accruals for pending bankruptcy litigation related to our SFO and LAX
municipal bond obligations and a $14 million benefit due to the Company’s ongoing efforts to resolve
certain other bankruptcy pre-confirmation contingencies. In the eleven months ended December 31,
2006, special items of $36 million included a $12 million benefit to adjust the Company’s recorded
obligation for the SFO and LAX municipal bonds and a $24 million benefit related to pre-confirmation
pension matters. The 2007 and 2006 special items resulted from revised estimates of the probable
amount to be allowed by the Bankruptcy Court and were recorded in accordance with AICPA Practice
Bulletin 11, Accounting for Preconfirmation Contingencies in Fresh-Start Reporting. See Note 4, “Voluntary
Reorganization Under Chapter 11” and Note 19, “Special Items” in Combined Notes to Consolidated
Financial Statements for further information on these special items and pending bankruptcy matters.
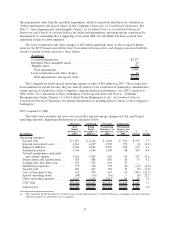
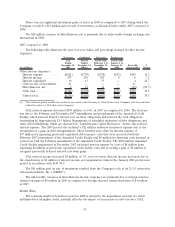
Other Income (Expense).
2008 compared to 2007
The following table illustrates the year-over-year dollar and percentage changes in UAL and United
other income (expense).
(In millions) 2008 2007 $ %
Year Ended
December 31,
Favorable/
(Unfavorable)
Change
Interest expense ...................................... $(523) $(661) $ 138 20.9
Interest income ...................................... 112 257 (145) (56.4)
Interest capitalized.................................... 20 19 1 5.3
Gain on sale of investment ............................. — 41 (41) (100.0)
Non-cash fuel hedge gain (loss).......................... (279) — (279) —
Cash fuel hedge gain (loss) ............................. (249) — (249) —
Miscellaneous, net .................................... (22) 2 (24) —
UAL total......................................... $(941) $(342) $(599) (175.1)
United total ....................................... $(941) $(339) $(602) (177.6)
UAL interest expense decreased $138 million, or 21%, in 2008 as compared to 2007. The 2008
period was favorably impacted by $1.5 billion of total credit facility prepayments and the February 2007
credit facility amendment, which lowered United’s interest rate on these obligations. Scheduled debt
obligation repayments throughout 2008 and 2007 also reduced interest expense in 2008 as compared to
2007. The Company has a significant amount of variable-rate debt. Lower benchmark interest rates on
these variable-rate borrowings also reduced the Company’s interest expense in 2008 as compared to
2007. Interest expense in 2007 included the write-off of $17 million of previously capitalized debt
issuance costs associated with the February 2007 Amended Credit Facility partial prepayment, $6 million
of financing costs associated with the February 2007 amendment and a gain of $22 million from a debt
extinguishment. The benefit of lower interest expense in 2008 was offset by a $145 million decrease in
interest income due to lower average cash and short-term investment balances and lower investment
yields. See Liquidity and Capital Resources below, for further details related to financing activities.
Nonoperating fuel hedge gains (losses) relate to hedging instruments that are not classified as
economic hedges. These net hedge gains (losses) are presented separately in the table above for
purposes of additional analysis. These hedging gains (losses) are due to favorable (unfavorable)
movements in crude oil prices relative to the fuel hedge instrument terms. See Item 7A, Quantitative and
Qualitative Disclosures about Market Risk and Note 13, “Fair Value Measurements and Derivative
Instruments,” in Combined Notes to Consolidated Financial Statements for further discussion of these
hedges.
53