United Airlines 2008 Annual Report Download - page 38
Download and view the complete annual report
Please find page 38 of the 2008 United Airlines annual report below. You can navigate through the pages in the report by either clicking on the pages listed below, or by using the keyword search tool below to find specific information within the annual report.-
 1
1 -
2
-
3
-
4
-
5
-
6
-
7
-
8
-
9
-
10
-
11
-
12
-
13
-
14
-
15
-
16
-
17
-
18
-
19
-
20
-
21
-
22
-
23
-
24
-
25
-
26
-
27
-
 28
28 -
 29
29 -
 30
30 -
 31
31 -
 32
32 -
 33
33 -
 34
34 -
 35
35 -
 36
36 -
 37
37 -
 38
38 -
 39
39 -
 40
40 -
 41
41 -
 42
42 -
 43
43 -
 44
44 -
 45
45 -
 46
46 -
 47
47 -
 48
48 -
49
-
50
-
51
-
52
-
53
-
54
-
55
-
56
-
57
-
58
-
59
-
60
-
61
-
62
-
63
-
64
-
65
-
66
-
67
-
68
-
69
-
70
-
71
-
72
-
73
-
74
-
75
-
76
-
77
-
78
-
79
-
80
-
81
-
82
-
83
-
84
-
85
-
86
-
87
-
88
-
89
-
90
-
91
-
92
-
93
-
94
-
95
-
96
-
97
-
98
-
99
-
100
-
101
-
102
-
103
-
104
-
105
-
106
-
107
-
108
-
109
-
110
-
111
-
112
-
113
-
114
-
115
-
116
-
117
-
118
-
119
-
120
-
121
-
122
-
123
-
124
-
125
-
126
-
127
-
128
-
129
-
130
-
131
-
132
-
133
-
134
-
135
-
136
-
137
-
138
-
139
-
140
-
141
-
142
-
143
-
144
-
145
-
146
-
147
-
148
-
149
-
150
-
151
-
152
-
153
-
154
-
155
-
156
-
157
-
158
-
159
 |
 |

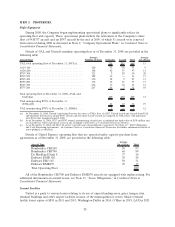
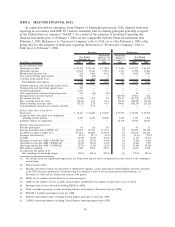
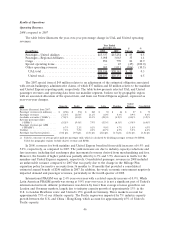
following table presents the unit cost of various components of total operating expenses and
year-over-year changes.
(In millions, except unit costs) 2008
2008 expense
per ASM
(in cents) 2007
2007 expense
per ASM
(in cents)
% change
per ASM
MainlineASMs...................... 135,861 141,890 (4.2)
Mainline fuel expense ................. $ 7,722 5.68 $ 5,003 3.53 60.9
United Aviation Fuel Corporation
(“UAFC”)........................ 4 — 36 0.02 (100.0)
Impairments, special items and other
charges(a) ........................ 2,807 2.07 (44) (0.03) —
Other operating expenses .............. 10,851 7.99 11,170 7.87 1.5
Total mainline operating expense ...... 21,384 15.74 16,165 11.39 38.2
Regional affiliate expense .............. 3,248 2,941
Consolidated operating expense ....... $ 24,632 $ 19,106
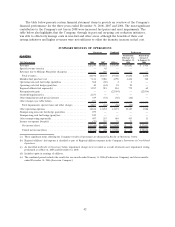
(a) These amounts are summarized in the Summary Results of Operations table in Financial Results, below.
In 2008, the Company focused on mitigating a portion of the negative impact of higher fuel costs
and the weakening economy through cost reductions, fleet optimization, generation of higher revenues,
executing on initiatives to enhance liquidity and other strategies as discussed below. Overall, the
Company has characterized its business approach as “Focus on Five,” which refers to a comprehensive
set of priorities that focus on the fundamentals of running a good airline: one that runs on time, with
clean planes and courteous employees, that delivers industry-leading revenues and competitive costs, and
does so safely. Building on this foundation, United aims to regain its industry-leading position in key
metrics reported by the DOT as well as industry-leading revenue driven by products, services, schedules
and routes that are valued by the Company’s customers. The goal of this approach is intended to enable
United to achieve best-in-class safety performance, exceptional customer satisfaction and experience and
industry-leading margin and cash flow. Although results of operations in 2008 were disappointing and
economic conditions continue to present a challenge for the Company, we believe we are taking the
necessary steps to position the Company for improved financial and operational performance in 2009.
Some of these actions include the following:
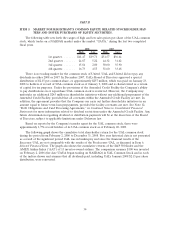
• The Company significantly reduced its mainline domestic and international capacity in response
to high fuel costs and the weakening global economy. Mainline domestic and international
capacity decreased 14% and 8%, respectively, during the fourth quarter of 2008 as compared to
the year-ago period. Mainline domestic capacity decreased 8% while international capacity
increased 1% for the full year of 2008, as compared to 2007. Consolidated capacity was
approximately 11% and 4% lower in the fourth quarter and the full year of 2008, respectively, as
compared to the year-ago periods. The Company will implement additional capacity reductions in
2009 as it completes the removal of 100 aircraft, as discussed below, of which 51 aircraft had been
removed from service as of December 31, 2008.
• The Company is permanently removing 100 aircraft from its fleet, including its entire fleet of 94
B737 aircraft and six B747 aircraft. These aircraft are some of the oldest and least fuel efficient
in the Company’s fleet. This reduction reflects the Company’s efforts to eliminate unprofitable
capacity and divest the Company of assets that currently do not provide an acceptable return,
particularly in the current economic environment with volatile fuel prices and a global economy
in recession. The Company continues to review the deployment of all of its aircraft in various
markets and the overall composition of its fleet to ensure that we are using our assets
appropriately to provide the best available return.
38