United Airlines 2008 Annual Report Download - page 34
Download and view the complete annual report
Please find page 34 of the 2008 United Airlines annual report below. You can navigate through the pages in the report by either clicking on the pages listed below, or by using the keyword search tool below to find specific information within the annual report.-
 1
1 -
2
-
3
-
4
-
5
-
6
-
7
-
8
-
9
-
10
-
11
-
12
-
13
-
14
-
15
-
16
-
17
-
18
-
19
-
20
-
21
-
22
-
23
-
 24
24 -
 25
25 -
 26
26 -
 27
27 -
 28
28 -
 29
29 -
 30
30 -
 31
31 -
 32
32 -
 33
33 -
 34
34 -
 35
35 -
 36
36 -
 37
37 -
 38
38 -
 39
39 -
 40
40 -
 41
41 -
 42
42 -
 43
43 -
 44
44 -
45
-
46
-
47
-
48
-
49
-
50
-
51
-
52
-
53
-
54
-
55
-
56
-
57
-
58
-
59
-
60
-
61
-
62
-
63
-
64
-
65
-
66
-
67
-
68
-
69
-
70
-
71
-
72
-
73
-
74
-
75
-
76
-
77
-
78
-
79
-
80
-
81
-
82
-
83
-
84
-
85
-
86
-
87
-
88
-
89
-
90
-
91
-
92
-
93
-
94
-
95
-
96
-
97
-
98
-
99
-
100
-
101
-
102
-
103
-
104
-
105
-
106
-
107
-
108
-
109
-
110
-
111
-
112
-
113
-
114
-
115
-
116
-
117
-
118
-
119
-
120
-
121
-
122
-
123
-
124
-
125
-
126
-
127
-
128
-
129
-
130
-
131
-
132
-
133
-
134
-
135
-
136
-
137
-
138
-
139
-
140
-
141
-
142
-
143
-
144
-
145
-
146
-
147
-
148
-
149
-
150
-
151
-
152
-
153
-
154
-
155
-
156
-
157
-
158
-
159
 |
 |

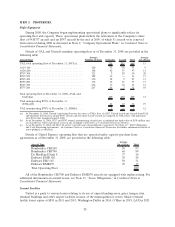
PART II
ITEM 5. MARKET FOR REGISTRANT’S COMMON EQUITY, RELATED STOCKHOLDER MAT-
TERS AND ISSUER PURCHASES OF EQUITY SECURITIES.
The following table sets forth the ranges of high and low sales prices per share of the UAL common
stock, which trades on a NASDAQ market under the symbol “UAUA,” during the last two completed
fiscal years.
High Low High Low
2008 2007
1st quarter ........ $41.47 $19.71 $51.57 $36.64
2nd quarter ....... 24.87 5.22 44.32 31.62
3rd quarter........ 15.84 2.80 50.00 35.90
4th quarter ........ 16.73 4.55 51.60 33.48
There is no trading market for the common stock of United. UAL and United did not pay any
dividends in either 2008 or 2007. In December 2007, UAL’s Board of Directors approved a special
distribution of $2.15 per common share, or approximately $257 million, which was paid on January 23,
2008 to holders of record of UAL common stock as of January 9, 2008 and is characterized as a return
of capital for tax purposes. Under the provisions of the Amended Credit Facility the Company’s ability
to pay distributions on or repurchase UAL common stock is restricted. However, the Company may
undertake an additional $243 million in shareholder initiatives without any additional prepayment of the
Amended Credit Facility, provided that all covenants within the Amended Credit Facility are met. In
addition, the agreement provides that the Company can carry out further shareholder initiatives in an
amount equal to future term loan prepayments, provided the facility covenants are met. See Note 12,
“Debt Obligations and Card Processing Agreements,” in Combined Notes to Consolidated Financial
Statements for more information related to dividend restrictions under the Amended Credit Facility. Any
future determination regarding dividend or distribution payments will be at the discretion of the Board
of Directors, subject to applicable limitations under Delaware law.
Based on reports by the Company’s transfer agent for the UAL common stock, there were
approximately 1,774 record holders of its UAL common stock as of February 20, 2009.
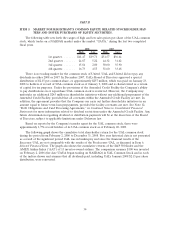
The following graph shows the cumulative total shareholder return for the UAL common stock
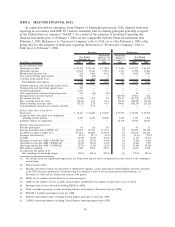
during the period from February 2, 2006 to December 31, 2008. Five year historical data is not presented
as a result of the significant period UAL was in bankruptcy and since the financial results of the
Successor UAL are not comparable with the results of the Predecessor UAL, as discussed in Item 6,
Selected Financial Data. The graph also shows the cumulative returns of the S&P 500 Index and the
AMEX Airline Index (“AAI”) of 13 investor-owned airlines. The comparison assumes $100 was invested
on February 2, 2006 (the date UAUA began trading on NASDAQ) in UAL Common Stock and in each
of the indices shown and assumes that all dividends paid, including UAL’s January 2008 $2.15 per share
distribution, were reinvested.
34