United Airlines 2008 Annual Report Download - page 57
Download and view the complete annual report
Please find page 57 of the 2008 United Airlines annual report below. You can navigate through the pages in the report by either clicking on the pages listed below, or by using the keyword search tool below to find specific information within the annual report.-
 1
1 -
2
-
3
-
4
-
5
-
6
-
7
-
8
-
9
-
10
-
11
-
12
-
13
-
14
-
15
-
16
-
17
-
18
-
19
-
20
-
21
-
22
-
23
-
24
-
25
-
26
-
27
-
28
-
29
-
30
-
31
-
32
-
33
-
34
-
35
-
36
-
37
-
38
-
39
-
40
-
41
-
42
-
43
-
44
-
45
-
46
-
 47
47 -
 48
48 -
 49
49 -
 50
50 -
 51
51 -
 52
52 -
 53
53 -
 54
54 -
 55
55 -
 56
56 -
 57
57 -
 58
58 -
 59
59 -
 60
60 -
 61
61 -
 62
62 -
 63
63 -
 64
64 -
 65
65 -
 66
66 -
 67
67 -
68
-
69
-
70
-
71
-
72
-
73
-
74
-
75
-
76
-
77
-
78
-
79
-
80
-
81
-
82
-
83
-
84
-
85
-
86
-
87
-
88
-
89
-
90
-
91
-
92
-
93
-
94
-
95
-
96
-
97
-
98
-
99
-
100
-
101
-
102
-
103
-
104
-
105
-
106
-
107
-
108
-
109
-
110
-
111
-
112
-
113
-
114
-
115
-
116
-
117
-
118
-
119
-
120
-
121
-
122
-
123
-
124
-
125
-
126
-
127
-
128
-
129
-
130
-
131
-
132
-
133
-
134
-
135
-
136
-
137
-
138
-
139
-
140
-
141
-
142
-
143
-
144
-
145
-
146
-
147
-
148
-
149
-
150
-
151
-
152
-
153
-
154
-
155
-
156
-
157
-
158
-
159
 |
 |

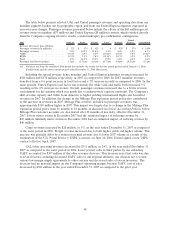
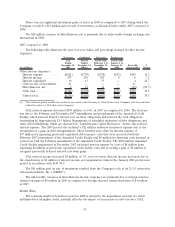
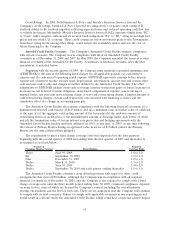
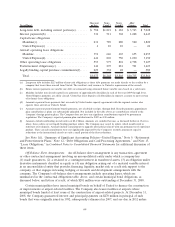
by operating, financing, investing and reorganization activities for the years ended December 31, 2008,
2007 and 2006 and total cash position as of December 31, 2008 and 2007.
(In millions) 2008 2007 2006
Year Ended December 31,
Net cash provided (used) by operating activities .............. $(1,239) $ 2,134 $1,562
Net cash provided (used) by investing activities ............... 2,721 (2,560) (250)
Net cash provided (used) by financing activities............... (702) (2,147) 782
Net cash used by reorganization activities ................... — — (23)
2008 2007
As of December 31,
Cash and cash equivalents ........................................ $2,039 $1,259
Short-term investments ........................................... — 2,295
Restricted cash ................................................. 272 756
Cash, short-term investments & restricted cash ........................ $2,311 $4,310
The Company’s cash and short-term investment position represents an important source of liquidity.
The change in cash from 2006 to 2008 is explained below. Restricted cash primarily represents cash
collateral to secure workers’ compensation obligations, security deposits for airport leases and reserves
with institutions that process our credit card ticket sales. We may be required to post significant
additional cash collateral to meet such obligations in the future. The Company has a $255 million
revolving commitment under its Amended Credit Facility, of which $254 million and $102 million had
been used for letters of credit as of December 31, 2008 and 2007, respectively. In addition, under a
separate agreement, the Company had $27 million of letters of credit issued as of December 31, 2008.
The increase of letters of credit issued in 2008 was primarily due to the providing of alternative collateral
in place of restricted cash deposits, thereby providing the Company with additional unrestricted cash.
Cash Flows from Operating Activities.
2008 compared to 2007
UAL’s cash from operations decreased by approximately $3.4 billion in 2008 as compared to 2007.
This decrease was primarily due to the increased cash required for fuel purchases and operating and
nonoperating cash fuel hedge losses. Mainline and regional affiliate fuel costs increased $3.1 billion in
2008 over 2007 and nonoperating expenses also increased over the same period largely due to cash and
non-cash fuel hedge losses. In addition, certain counterparties to our fuel hedge instruments required
the Company to provide cash collateral deposits of approximately $965 million in 2008, which negatively
impacted our cash flows during this period as compared to 2007 when no similar deposits were required.
A decrease in advance ticket sales also negatively impacted operating cash flow in 2008. Partially
offsetting the negative impacts were $500 million of proceeds from the advanced purchase of miles by
our co-branded credit card partner as part of the amendment of our marketing agreement and
$100 million of proceeds from the extension of the license previously granted to our co-branded credit
card partner to be the exclusive issuer of Mileage Plus Visa cards through 2017. In 2008, the Company
contributed approximately $240 million and $22 million to its defined contribution plans and
non-U.S. pension plans, respectively, as compared to contributions of $236 million and $14 million,
respectively, in 2007 for these plans.
2007 compared to 2006
The Company’s cash from operations improved by more than $500 million year-over-year. The
Company’s improvement in net income excluding primarily non-cash reorganization items, was a
significant factor contributing to the increase in operating cash flows. Operating cash flows for 2007 also
include the favorable impact of an increase in non-cash income tax expense of nearly $300 million as
compared to 2006. In addition, cash from operations improved due to a reduction of $124 million in
cash interest payments in 2007 as compared to 2006 as a result of the financing activities completed in
57