United Airlines 2008 Annual Report Download - page 119
Download and view the complete annual report
Please find page 119 of the 2008 United Airlines annual report below. You can navigate through the pages in the report by either clicking on the pages listed below, or by using the keyword search tool below to find specific information within the annual report.-
 1
1 -
2
-
3
-
4
-
5
-
6
-
7
-
8
-
9
-
10
-
11
-
12
-
13
-
14
-
15
-
16
-
17
-
18
-
19
-
20
-
21
-
22
-
23
-
24
-
25
-
26
-
27
-
28
-
29
-
30
-
31
-
32
-
33
-
34
-
35
-
36
-
37
-
38
-
39
-
40
-
41
-
42
-
43
-
44
-
45
-
46
-
47
-
48
-
49
-
50
-
51
-
52
-
53
-
54
-
55
-
56
-
57
-
58
-
59
-
60
-
61
-
62
-
63
-
64
-
65
-
66
-
67
-
68
-
69
-
70
-
71
-
72
-
73
-
74
-
75
-
76
-
77
-
78
-
79
-
80
-
81
-
82
-
83
-
84
-
85
-
86
-
87
-
88
-
89
-
90
-
91
-
92
-
93
-
94
-
95
-
96
-
97
-
98
-
99
-
100
-
101
-
102
-
103
-
104
-
105
-
106
-
107
-
108
-
 109
109 -
 110
110 -
 111
111 -
 112
112 -
 113
113 -
 114
114 -
 115
115 -
 116
116 -
 117
117 -
 118
118 -
 119
119 -
 120
120 -
 121
121 -
 122
122 -
 123
123 -
 124
124 -
 125
125 -
 126
126 -
 127
127 -
 128
128 -
 129
129 -
130
-
131
-
132
-
133
-
134
-
135
-
136
-
137
-
138
-
139
-
140
-
141
-
142
-
143
-
144
-
145
-
146
-
147
-
148
-
149
-
150
-
151
-
152
-
153
-
154
-
155
-
156
-
157
-
158
-
159
 |
 |

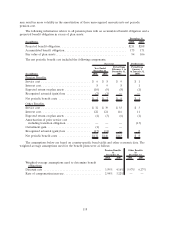
2008 2007 2008 2007
December 31,
Year Ended
December 31,
Year Ended
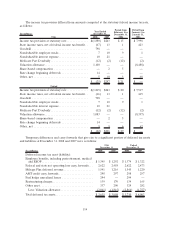
Pension Benefits Other Benefits
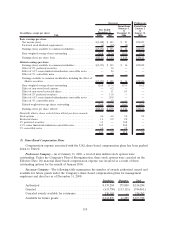
Weighted-average assumptions used to determine net
expense
Discount rate ..................................... 4.16% 3.88% 6.27% 5.93%
Expected return on plan assets ........................ 6.31% 6.38% 6.50% 6.50%
Rate of compensation increase ........................ 3.22% 3.15% — —
The expected return on plan assets is based on an evaluation of the historical behavior of the broad
financial markets and the Company’s investment portfolio.
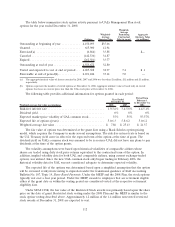
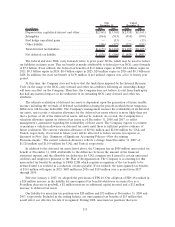
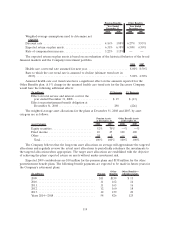
2008 2007
Health care cost trend rate assumed for next year.......................... 8.00% 8.50%
Rate to which the cost trend rate is assumed to decline (ultimate trend rate in
2015)........................................................... 5.00% 4.50%
Assumed health care cost trend rates have a significant effect on the amounts reported for the
Other Benefits plan. A 1% change in the assumed health care trend rate for the Successor Company
would have the following additional effects:
(In millions) 1% Increase 1% Decrease
Effect on total service and interest cost for the
year ended December 31, 2008 ...................... $ 19 $ (13)
Effect on postretirement benefit obligation at
December 31, 2008 ............................... 290 (226)
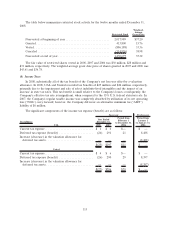
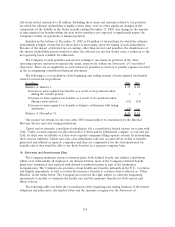
The weighted-average asset allocations for the plans at December 31, 2008 and 2007, by asset
category are as follows:
Asset Category 2008 2007 2008 2007
Pension Assets
at December 31
Other Benefit Assets
at December 31
Equity securities ......................... 52% 70% —% —%
Fixed income . .......................... 10 25 100 100
Other ................................. 38 5 — —
Total ................................ 100% 100% 100% 100%
The Company believes that the long-term asset allocations on average will approximate the targeted
allocations and regularly reviews the actual asset allocations to periodically rebalance the investments to
the targeted allocations when appropriate. The target asset allocations are established with the objective
of achieving the plans’ expected return on assets without undue investment risk.
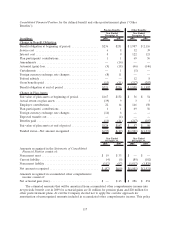
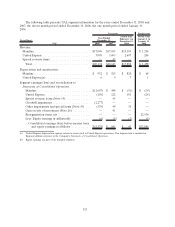
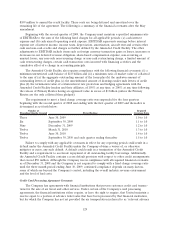
Expected 2009 contributions are $10 million for the pension plans and $158 million for the other
postretirement benefit plans. The following benefit payments are expected to be made in future years for
the Company’s retirement plans:
(In millions) Pension
Other
Benefits
Other Benefits—
subsidy receipts
2009 ..................................... $11 $159 $ 13
2010 ..................................... 11 162 14
2011 ..................................... 11 163 16
2012 ..................................... 12 160 18
2013 ..................................... 12 159 20
Years 2014—2018 .......................... 58 826 125
119