United Airlines 2008 Annual Report Download - page 48
Download and view the complete annual report
Please find page 48 of the 2008 United Airlines annual report below. You can navigate through the pages in the report by either clicking on the pages listed below, or by using the keyword search tool below to find specific information within the annual report.-
 1
1 -
2
-
3
-
4
-
5
-
6
-
7
-
8
-
9
-
10
-
11
-
12
-
13
-
14
-
15
-
16
-
17
-
18
-
19
-
20
-
21
-
22
-
23
-
24
-
25
-
26
-
27
-
28
-
29
-
30
-
31
-
32
-
33
-
34
-
35
-
36
-
37
-
 38
38 -
 39
39 -
 40
40 -
 41
41 -
 42
42 -
 43
43 -
 44
44 -
 45
45 -
 46
46 -
 47
47 -
 48
48 -
 49
49 -
 50
50 -
 51
51 -
 52
52 -
 53
53 -
 54
54 -
 55
55 -
 56
56 -
 57
57 -
 58
58 -
59
-
60
-
61
-
62
-
63
-
64
-
65
-
66
-
67
-
68
-
69
-
70
-
71
-
72
-
73
-
74
-
75
-
76
-
77
-
78
-
79
-
80
-
81
-
82
-
83
-
84
-
85
-
86
-
87
-
88
-
89
-
90
-
91
-
92
-
93
-
94
-
95
-
96
-
97
-
98
-
99
-
100
-
101
-
102
-
103
-
104
-
105
-
106
-
107
-
108
-
109
-
110
-
111
-
112
-
113
-
114
-
115
-
116
-
117
-
118
-
119
-
120
-
121
-
122
-
123
-
124
-
125
-
126
-
127
-
128
-
129
-
130
-
131
-
132
-
133
-
134
-
135
-
136
-
137
-
138
-
139
-
140
-
141
-
142
-
143
-
144
-
145
-
146
-
147
-
148
-
149
-
150
-
151
-
152
-
153
-
154
-
155
-
156
-
157
-
158
-
159
 |
 |

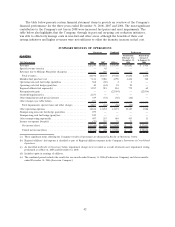
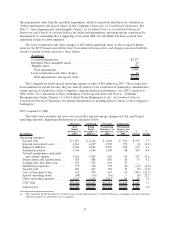
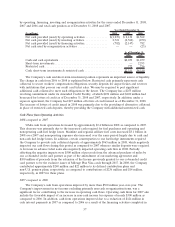
The table below presents selected UAL and United passenger revenues and operating data from our
mainline segment, broken out by geographic region, and from our United Express segment, expressed as
year-over-year changes. Passenger revenues presented below include the effects of the $45 million special
revenue items on mainline ($37 million) and United Express ($8 million) revenue, which resulted directly
from the Company’s ongoing efforts to resolve certain bankruptcy pre-confirmation contingencies.
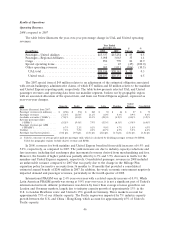
2007 Domestic Pacific Atlantic Latin Mainline
United
Express Consolidated
Increase (decrease) from 2006(a):
Passenger revenues (in millions) ......... $ 121 $ 374 $ 423 $ 6 $ 924 $ 170 $ 1,094
Passenger revenues . . . ............... 1.3% 12.9% 21.8% 1.3% 6.4% 5.9% 6.3%
ASMs........................... (3.3)% 2.9% 6.8% (10.2)% (0.8)% 3.6% (0.4)%
RPMs........................... (1.5)% 1.1% 7.6% (11.0)% (0.1)% 3.2% 0.2%
Yield ........................... 3.0% 11.8% 14.0% 13.9% 6.6% 2.6% 6.2%
Passenger load factor (points) .......... 1.5pts (1.5)pts 0.6pts (0.7)pts 0.6pts (0.3)pts 0.5pts
(a) Variances are from the combined 2006 period that includes the results for the one month period ended January 31, 2006
(Predecessor) and the eleven month period ended December 31, 2006 (Successor).
Including the special revenue items, mainline and United Express passenger revenues increased by
$924 million and $170 million, respectively, in 2007 as compared to 2006. In 2007, mainline revenues
benefited from a 0.6 point increase in load factor and a 7% increase in yield as compared to 2006. In the
same periods, United Express load factor was relatively flat while yield and traffic both increased 3%
resulting in the 6% increase in revenue. Overall, passenger revenues increased due to a better revenue
environment for the industry which was partly due to industry-wide capacity constraint. The Company’s
shift of some capacity and traffic from domestic to higher yielding international flights also benefited
revenues in 2007. In addition, the change in the Mileage Plus expiration period policy also contributed
to the increase in revenues in 2007. Mileage Plus revenue, included in passenger revenues, was
approximately $169 million higher in 2007. This impact was largely due to a change in the Mileage Plus
expiration period policy from 36 months to 18 months, as discussed in Critical Accounting Policies, below.
Mileage Plus customer accounts are deactivated after 18 months of inactivity, effective December 31,
2007. Severe winter storms in December 2007 had the estimated impact of reducing revenue by
$25 million. Similarly winter storms in December 2006 had an estimated impact of reducing revenue by
$40 million.
Cargo revenues increased by $20 million, or 3%, in the year ended December 31, 2007 as compared
to the same period in 2006. Freight revenue increased due to both higher yields and higher volume. This
increase was partially offset by a reduction in mail revenue due to lower 2007 volume as a result of the
termination of the U.S. Postal Service (“USPS”) contract on June 30, 2006. United signed a new USPS
contract effective April, 2007.
UAL other operating revenues decreased by $311 million, or 24%, in the year ended December 31,
2007 as compared to the same period in 2006. Lower jet fuel sales to third parties by our subsidiary
UAFC accounted for $307 million of the other revenue decrease. This decrease in jet fuel sales was due
to several factors, including decreased UAFC sales to our regional affiliates, our decision not to renew
various low margin supply agreements to other carriers and decreased sales of excess inventory. This
decrease had no material impact on the Company’s operating margin, because UAFC cost of sales
decreased by $306 million in the year ended December 31, 2007 as compared to the prior year.
48