United Airlines 2008 Annual Report Download - page 42
Download and view the complete annual report
Please find page 42 of the 2008 United Airlines annual report below. You can navigate through the pages in the report by either clicking on the pages listed below, or by using the keyword search tool below to find specific information within the annual report.-
 1
1 -
2
-
3
-
4
-
5
-
6
-
7
-
8
-
9
-
10
-
11
-
12
-
13
-
14
-
15
-
16
-
17
-
18
-
19
-
20
-
21
-
22
-
23
-
24
-
25
-
26
-
27
-
28
-
29
-
30
-
31
-
 32
32 -
 33
33 -
 34
34 -
 35
35 -
 36
36 -
 37
37 -
 38
38 -
 39
39 -
 40
40 -
 41
41 -
 42
42 -
 43
43 -
 44
44 -
 45
45 -
 46
46 -
 47
47 -
 48
48 -
 49
49 -
 50
50 -
 51
51 -
 52
52 -
53
-
54
-
55
-
56
-
57
-
58
-
59
-
60
-
61
-
62
-
63
-
64
-
65
-
66
-
67
-
68
-
69
-
70
-
71
-
72
-
73
-
74
-
75
-
76
-
77
-
78
-
79
-
80
-
81
-
82
-
83
-
84
-
85
-
86
-
87
-
88
-
89
-
90
-
91
-
92
-
93
-
94
-
95
-
96
-
97
-
98
-
99
-
100
-
101
-
102
-
103
-
104
-
105
-
106
-
107
-
108
-
109
-
110
-
111
-
112
-
113
-
114
-
115
-
116
-
117
-
118
-
119
-
120
-
121
-
122
-
123
-
124
-
125
-
126
-
127
-
128
-
129
-
130
-
131
-
132
-
133
-
134
-
135
-
136
-
137
-
138
-
139
-
140
-
141
-
142
-
143
-
144
-
145
-
146
-
147
-
148
-
149
-
150
-
151
-
152
-
153
-
154
-
155
-
156
-
157
-
158
-
159
 |
 |

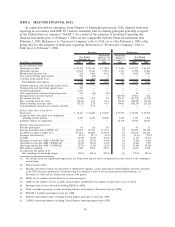
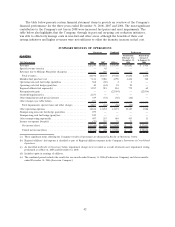
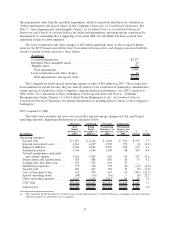
The table below presents certain financial statement items to provide an overview of the Company’s
financial performance for the three years ended December 31, 2008, 2007 and 2006. The most significant
contributors to the Company’s net loss in 2008 were increased fuel prices and asset impairments. The
table below also highlights that the Company, through its past and on-going cost reduction initiatives,
was able to effectively manage costs in non-fuel and other areas, although the benefits of these cost
savings initiatives and higher revenues were not sufficient to offset the dramatic increase in fuel cost.
SUMMARY RESULTS OF OPERATIONS
(In millions)
UAL Information 2008 2007 2006(e)
Period from
February 1 to
December 31,
2006
Period from
January 1
to January 31,
2006
Successor Combined Predecessor
Revenues . . . ..................................... $20,194 $19,852 $ 19,340 $17,882 $ 1,458
Special revenue items(a) . . ........................... — 45 — — —
Revenues due to Mileage Plus policy change(a) . ............ — 246 — — —
Total revenues . . . ................................ 20,194 20,143 19,340 17,882 1,458
Mainline fuel purchase cost ........................... 7,114 5,086 4,798 4,436 362
Operating non-cash fuel hedge (gain)/loss ................. 568 (20) 2 2 —
Operating cash fuel hedge (gain)/loss..................... 40 (63) 24 24 —
Regional affiliate fuel expense(b) . ...................... 1,257 915 834 772 62
Reorganizationgain ................................ — — (22,934) — (22,934)
Goodwill impairment(c) . . . ........................... 2,277 — — — —
Other impairments and special items(c) . . ................. 339 (44) (36) (36) —
Other charges (see table below) . . ...................... 191 — — — —
Total impairments, special items and other charges . . . ....... 2,807 (44) (36) (36) —
Other operating expenses . . ........................... 12,846 13,232 13,271 12,185 1,086
Nonoperating non-cash fuel hedge (gain)/loss . . . ............ 279 — — — —
Nonoperating cash fuel hedge (gain)/loss . ................. 249 — — — —
Other nonoperating expense(d). . . ...................... 407 337 484 453 31
Income tax expense (benefit) .......................... (25) 297 21 21 —
Netincome(loss) ................................ $(5,348) $ 403 $ 22,876 $ 25 $ 22,851
Unitednetincome(loss) ........................... $(5,306) $ 402 $ 22,658 $ 32 $ 22,626
(a) These significant items affecting the Company’s results of operations are discussed in Results of Operations, below.
(b) Regional affiliates’ fuel expense is classified as part of Regional affiliates expense in the Company’s Statements of Consolidated
Operations.
(c) As described in Results of Operations below, impairment charges were recorded as a result of interim asset impairment testing
performed as of May 31, 2008 and December 31, 2008.
(d) Includes equity in earnings of affiliates.
(e) The combined period includes the results for one month ended January 31, 2006 (Predecessor Company) and eleven months
ended December 31, 2006 (Successor Company).
42