United Airlines 2008 Annual Report Download - page 112
Download and view the complete annual report
Please find page 112 of the 2008 United Airlines annual report below. You can navigate through the pages in the report by either clicking on the pages listed below, or by using the keyword search tool below to find specific information within the annual report.-
 1
1 -
2
-
3
-
4
-
5
-
6
-
7
-
8
-
9
-
10
-
11
-
12
-
13
-
14
-
15
-
16
-
17
-
18
-
19
-
20
-
21
-
22
-
23
-
24
-
25
-
26
-
27
-
28
-
29
-
30
-
31
-
32
-
33
-
34
-
35
-
36
-
37
-
38
-
39
-
40
-
41
-
42
-
43
-
44
-
45
-
46
-
47
-
48
-
49
-
50
-
51
-
52
-
53
-
54
-
55
-
56
-
57
-
58
-
59
-
60
-
61
-
62
-
63
-
64
-
65
-
66
-
67
-
68
-
69
-
70
-
71
-
72
-
73
-
74
-
75
-
76
-
77
-
78
-
79
-
80
-
81
-
82
-
83
-
84
-
85
-
86
-
87
-
88
-
89
-
90
-
91
-
92
-
93
-
94
-
95
-
96
-
97
-
98
-
99
-
100
-
101
-
 102
102 -
 103
103 -
 104
104 -
 105
105 -
 106
106 -
 107
107 -
 108
108 -
 109
109 -
 110
110 -
 111
111 -
 112
112 -
 113
113 -
 114
114 -
 115
115 -
 116
116 -
 117
117 -
 118
118 -
 119
119 -
 120
120 -
 121
121 -
 122
122 -
123
-
124
-
125
-
126
-
127
-
128
-
129
-
130
-
131
-
132
-
133
-
134
-
135
-
136
-
137
-
138
-
139
-
140
-
141
-
142
-
143
-
144
-
145
-
146
-
147
-
148
-
149
-
150
-
151
-
152
-
153
-
154
-
155
-
156
-
157
-
158
-
159
 |
 |

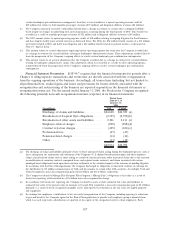
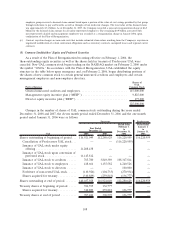
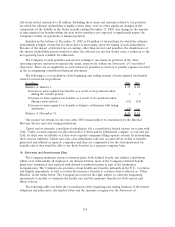
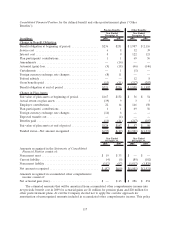
The table below summarizes stock option activity pursuant to UAL’s Management Plan stock
options for the year ended December 31, 2008:
Options
Weighted-
Average
Exercise Price
Weighted-
Average
Remaining
Contractual
Life (in years)
Aggregate
Intrinsic Value
(in millions)
Outstanding at beginning of year . . .......... 4,150,093 $35.66
Granted ................................ 615,900 12.94
Exercised(a) ............................ (6,864) 33.88 $—
Canceled ............................... (142,536) 34.87
Expired ................................ (262,921) 33.77
Outstanding at end of year ................. 4,353,672 32.80
Vested and expected to vest at end of period . . . 4,005,308 32.97 7.4 $ 1
Exercisable at end of period(b) .............. 2,031,242 35.14 7.0 —
(a) The aggregate intrinsic value of shares exercised in 2008, 2007 and 2006 was less than $1 million, $11 million and $3 million,
respectively.
(b) Options represent the number of vested options at December 31, 2008. Aggregate intrinsic value is based only on vested
options that have an exercise price less than the UAL stock price at December 31, 2008.
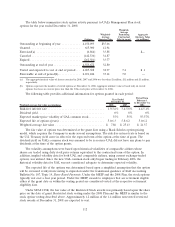
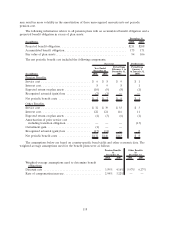
The following table provides additional information for options granted in each period:
Weighted-average fair value assumptions: 2008 2007
Period from
February 1
to December 31,
2006
Year Ended
December 31,
Risk-free interest rate .................................... 1.9-3.6% 3.4-5.0% 4.4-5.1%
Dividend yield .......................................... 0% 0% 0%
Expected market price volatility of UAL common stock. . . ....... 55% 55% 55-57%
Expected life of options (years) ............................ 5.0-6.3 5.8-6.2 5.0-6.2
Weighted-average fair value ............................... $ 7.86 $ 25.13 $ 21.37
The fair value of options was determined at the grant date using a Black Scholes option pricing
model, which requires the Company to make several assumptions. The risk-free interest rate is based on
the U.S. Treasury yield curve in effect for the expected term of the option at the time of grant. The
dividend yield on UAL’s common stock was assumed to be zero since UAL did not have any plans to pay
dividends at the time of the option grants.
The volatility assumptions were based upon historical volatilities of comparable airlines whose
shares are traded using daily stock price returns equivalent to the contractual term of the option. In
addition, implied volatility data for both UAL and comparable airlines, using current exchange-traded
options, was utilized. Since the new UAL common stock only began trading in February 2006, the
historical volatility data for UAL was not considered adequate to determine expected volatility.
The expected life of the options was determined based upon a simplified assumption that the option
will be exercised evenly from vesting to expiration under the transitional guidance of Staff Accounting
Bulletin No. 107, Topic 14, Share-Based Payments. Under the MEIP and the 2008 Plan, the stock options
typically vest over a four year period. Under the MEIP, awards to employees that are retirement eligible
either at the grant date or within the vesting period are considered vested at the respective retirement
eligibility date.
Under SFAS 123R, the fair value of the Restricted Stock awards was primarily based upon the share
price on the date of grant. Restricted stock vesting under the 2008 Plan and the MEIP is similar to the
stock option vesting described above. Approximately 1.2 million of the 1.4 million non-vested restricted
stock awards at December 31, 2008 are expected to vest.
112