United Airlines 2008 Annual Report Download - page 113
Download and view the complete annual report
Please find page 113 of the 2008 United Airlines annual report below. You can navigate through the pages in the report by either clicking on the pages listed below, or by using the keyword search tool below to find specific information within the annual report.-
 1
1 -
2
-
3
-
4
-
5
-
6
-
7
-
8
-
9
-
10
-
11
-
12
-
13
-
14
-
15
-
16
-
17
-
18
-
19
-
20
-
21
-
22
-
23
-
24
-
25
-
26
-
27
-
28
-
29
-
30
-
31
-
32
-
33
-
34
-
35
-
36
-
37
-
38
-
39
-
40
-
41
-
42
-
43
-
44
-
45
-
46
-
47
-
48
-
49
-
50
-
51
-
52
-
53
-
54
-
55
-
56
-
57
-
58
-
59
-
60
-
61
-
62
-
63
-
64
-
65
-
66
-
67
-
68
-
69
-
70
-
71
-
72
-
73
-
74
-
75
-
76
-
77
-
78
-
79
-
80
-
81
-
82
-
83
-
84
-
85
-
86
-
87
-
88
-
89
-
90
-
91
-
92
-
93
-
94
-
95
-
96
-
97
-
98
-
99
-
100
-
101
-
102
-
 103
103 -
 104
104 -
 105
105 -
 106
106 -
 107
107 -
 108
108 -
 109
109 -
 110
110 -
 111
111 -
 112
112 -
 113
113 -
 114
114 -
 115
115 -
 116
116 -
 117
117 -
 118
118 -
 119
119 -
 120
120 -
 121
121 -
 122
122 -
 123
123 -
124
-
125
-
126
-
127
-
128
-
129
-
130
-
131
-
132
-
133
-
134
-
135
-
136
-
137
-
138
-
139
-
140
-
141
-
142
-
143
-
144
-
145
-
146
-
147
-
148
-
149
-
150
-
151
-
152
-
153
-
154
-
155
-
156
-
157
-
158
-
159
 |
 |

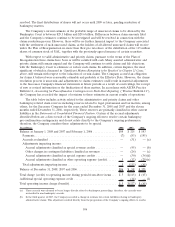
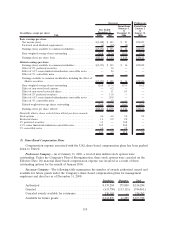
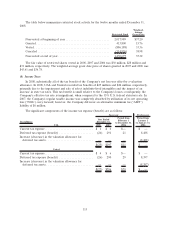
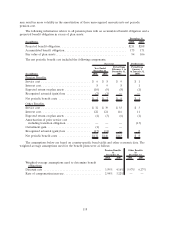
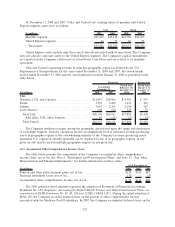
The table below summarizes restricted stock activity for the twelve months ended December 31,
2008:
Restricted Stock
Weighted-
Average
Grant Price
Non-vested at beginning of year ............................ 2,017,989 $37.20
Granted............................................... 413,800 15.76
Vested................................................ (886,188) 33.36
Canceled .............................................. (114,926) 38.98
Non-vested at end of year ................................. 1,430,675 35.32
The fair value of restricted shares vested in 2008, 2007 and 2006 was $30 million, $28 million and
$31 million, respectively. The weighted-average grant date price of shares granted in 2007 and 2006 was
$43.61 and $36.78.
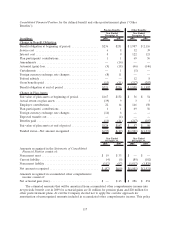
(8) Income Taxes
In 2008, substantially all of the tax benefit of the Company’s net loss was offset by a valuation
allowance. In 2008, UAL and United recorded tax benefits of $25 million and $22 million, respectively,
primarily due to the impairment and sale of select indefinite-lived intangibles and the impact of an
increase in state tax rates. This tax benefit is small relative to the Company’s losses; consequently, the
Company’s effective tax rate is insignificant, when compared to the 35% U.S. federal statutory rate. In
2007, the Company’s regular taxable income was completely absorbed by utilization of its net operating
loss (“NOL”) carry forward; however, the Company did incur an alternative minimum tax (“AMT”)
liability of $6 million.
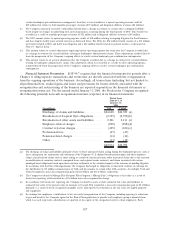
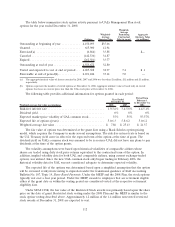
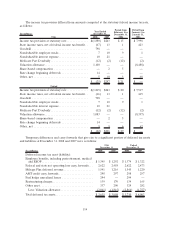
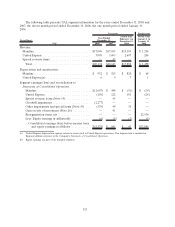
The significant components of the income tax expense (benefit) are as follows:
UAL 2008 2007
Period from
February 1
to December 31,
2006
Period from
January 1
to January 31,
2006
Year Ended
December 31,
Successor
(In millions)
Predecessor
Current tax expense ............................... $ 1 $ 6 $— $ —
Deferred tax expense (benefit) ...................... (26) 291 21 8,488
Increase (decrease) in the valuation allowance for
deferred tax assets .............................. — — — (8,488)
$(25) $297 $21 $ —
United
Current tax expense ............................... $ 4 $ 6 $— $ —
Deferred tax expense (benefit) ...................... (26) 290 29 8,397
Increase (decrease) in the valuation allowance for
deferred tax assets .............................. — — — (8,397)
$(22) $296 $29 $ —
113