United Airlines 2008 Annual Report Download - page 75
Download and view the complete annual report
Please find page 75 of the 2008 United Airlines annual report below. You can navigate through the pages in the report by either clicking on the pages listed below, or by using the keyword search tool below to find specific information within the annual report.-
 1
1 -
2
-
3
-
4
-
5
-
6
-
7
-
8
-
9
-
10
-
11
-
12
-
13
-
14
-
15
-
16
-
17
-
18
-
19
-
20
-
21
-
22
-
23
-
24
-
25
-
26
-
27
-
28
-
29
-
30
-
31
-
32
-
33
-
34
-
35
-
36
-
37
-
38
-
39
-
40
-
41
-
42
-
43
-
44
-
45
-
46
-
47
-
48
-
49
-
50
-
51
-
52
-
53
-
54
-
55
-
56
-
57
-
58
-
59
-
60
-
61
-
62
-
63
-
64
-
 65
65 -
 66
66 -
 67
67 -
 68
68 -
 69
69 -
 70
70 -
 71
71 -
 72
72 -
 73
73 -
 74
74 -
 75
75 -
 76
76 -
 77
77 -
 78
78 -
 79
79 -
 80
80 -
 81
81 -
 82
82 -
 83
83 -
 84
84 -
 85
85 -
86
-
87
-
88
-
89
-
90
-
91
-
92
-
93
-
94
-
95
-
96
-
97
-
98
-
99
-
100
-
101
-
102
-
103
-
104
-
105
-
106
-
107
-
108
-
109
-
110
-
111
-
112
-
113
-
114
-
115
-
116
-
117
-
118
-
119
-
120
-
121
-
122
-
123
-
124
-
125
-
126
-
127
-
128
-
129
-
130
-
131
-
132
-
133
-
134
-
135
-
136
-
137
-
138
-
139
-
140
-
141
-
142
-
143
-
144
-
145
-
146
-
147
-
148
-
149
-
150
-
151
-
152
-
153
-
154
-
155
-
156
-
157
-
158
-
159
 |
 |

December 31, 2008. The Company recognizes changes in fair value of these securities through other
comprehensive income; however, on a net basis, the Company is not exposed to market risk due to the
existence of offsetting changes in the fair value of the Company’s related debt obligations.
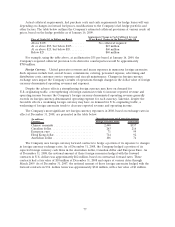
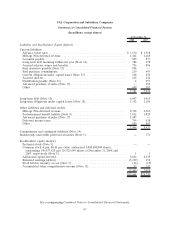
The material changes in the amounts reported in the table above for 2008 as compared to 2007
include the following: (1) cash and short-term investments decreased by approximately $1.5 billion
primarily due to cash used for operating activities as discussed in Liquidity above; (2) lease deposits
decreased by $190 million due to scheduled payments and aircraft acquisitions under lease agreement
terms; and (3) debt obligations decreased by $316 million primarily due to scheduled debt repayments in
2008, which were partially offset by new debt issuances in 2008. The interest rate on the Company’s cash
and variable rate debt decreased in 2008, as compared to 2007, primarily due to a decrease in market
interest rates.
Commodity Price Risk (Jet Fuel). Our results of operations and liquidity have been, and may
continue to be, materially impacted by changes in the price of aircraft fuel and other oil-related
commodities and related derivative instruments. When market conditions indicate risk reduction is
achievable, United may use commodity option contracts or other derivative instruments to reduce its
price risk exposure to jet fuel. The Company’s derivative positions are typically comprised of crude oil,
heating oil and jet fuel derivatives. The derivative instruments are designed to provide protection against
increases in the price of aircraft fuel. Some derivative instruments may result in hedging losses if the
underlying commodity prices drop below specified floors; however, the negative impact of these losses
may be offset by the benefit of lower jet fuel acquisition cost since the Company typically does not hedge
all of its fuel consumption. United may adjust its hedging program based on changes in market
conditions. At December 31, 2008, the fair value of United’s fuel-related derivatives was a payable of
$867 million, as compared to a receivable of $20 million at December 31, 2007. The primary reason for
this change was due to the dramatic spike in fuel prices through July 2008 and the subsequent fuel price
decreases in the latter part of 2008. At December 31, 2008, the fuel derivative payables includes
$140 million related to pending settlements for purchased options and expired contracts.
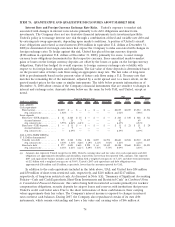
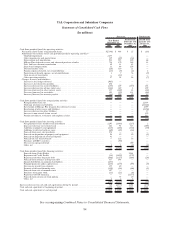
As of December 31, 2008, the Company had hedged its forecasted consolidated fuel consumption as
shown in the table below.
Percentage of
Projected
Fuel
Requirements
Hedged(a)
Purchased
Puts
Sold
Puts(a)
Purchased
Calls
Sold
Calls
Payment
Obligations
Stop
Payment
Obligations
Begin
Hedge
Protection
Begins
Hedge
Protection
Ends
Barrels hedged (in 000s) Weighted-average price per barrel
First Quarter 2009: . . . % $ $ $ $
Calls ............ 14 — — 1,975 — NA NA 83(b) NA
Collars ........... 9(10) — 1,425 1,275 — NA 109 118 NA
3-way collars ....... 25(29) — 4,125 3,525 3,525 NA 104 118 143
4-way collars ....... 2 225 225 225 225 63 78 95 135
Total........... 50 225 5,775 7,000 3,750
Purchasedputs ..... 35 4,925 — — — 57 NA NA NA
Full Year 2009:
Calls ............ 9 — — 5,350 — NA NA 81(c) NA
Collars ........... 5 (6) — 3,450 2,775 — NA 111 123 NA
3-way collars ....... 18(22) — 12,525 10,350 10,350 NA 102 118 147
4-way collars ....... 2 900 900 900 900 63 78 95 135
Total........... 34 900 16,875 19,375 11,250
Purchasedputs ..... 17 9,500 — — — 54 NA NA NA
Calls purchased from
January 1, 2009 to
January 16, 2009:
First Quarter 2009 . . . 4 — — 525 — NA NA 54 NA
Full Year 2009 ...... 2 — — 1,350 — NA NA 59 NA
75