United Airlines 2008 Annual Report Download - page 7
Download and view the complete annual report
Please find page 7 of the 2008 United Airlines annual report below. You can navigate through the pages in the report by either clicking on the pages listed below, or by using the keyword search tool below to find specific information within the annual report.-
 1
1 -
 2
2 -
 3
3 -
 4
4 -
 5
5 -
 6
6 -
 7
7 -
 8
8 -
 9
9 -
 10
10 -
 11
11 -
 12
12 -
 13
13 -
 14
14 -
 15
15 -
 16
16 -
 17
17 -
 18
18 -
19
-
20
-
21
-
22
-
23
-
24
-
25
-
26
-
27
-
28
-
29
-
30
-
31
-
32
-
33
-
34
-
35
-
36
-
37
-
38
-
39
-
40
-
41
-
42
-
43
-
44
-
45
-
46
-
47
-
48
-
49
-
50
-
51
-
52
-
53
-
54
-
55
-
56
-
57
-
58
-
59
-
60
-
61
-
62
-
63
-
64
-
65
-
66
-
67
-
68
-
69
-
70
-
71
-
72
-
73
-
74
-
75
-
76
-
77
-
78
-
79
-
80
-
81
-
82
-
83
-
84
-
85
-
86
-
87
-
88
-
89
-
90
-
91
-
92
-
93
-
94
-
95
-
96
-
97
-
98
-
99
-
100
-
101
-
102
-
103
-
104
-
105
-
106
-
107
-
108
-
109
-
110
-
111
-
112
-
113
-
114
-
115
-
116
-
117
-
118
-
119
-
120
-
121
-
122
-
123
-
124
-
125
-
126
-
127
-
128
-
129
-
130
-
131
-
132
-
133
-
134
-
135
-
136
-
137
-
138
-
139
-
140
-
141
-
142
-
143
-
144
-
145
-
146
-
147
-
148
-
149
-
150
-
151
-
152
-
153
-
154
-
155
-
156
-
157
-
158
-
159
 |
 |

fuel put options with identical expiration dates. If fuel prices rise above the ceiling of the collar, the
Company’s counterparties are required to make settlement payments to the Company, while if fuel
prices fall below the floor of the collars, the Company is required to make settlement payments to its
fuel hedge counterparties. In addition, the Company has been and may in the future be further required
to provide counterparties with cash collateral prior to settlement of the hedge positions.
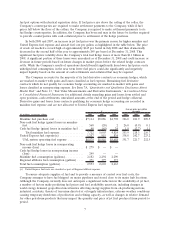
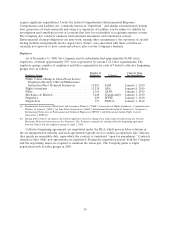
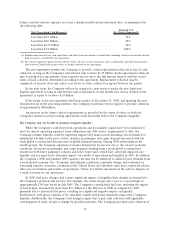
In both 2008 and 2007, an increase in jet fuel prices was the primary reason for higher mainline and
United Express fuel expense and aircraft fuel cost per gallon, as highlighted in the table below. The price
of crude oil reached a record high of approximately $145 per barrel in July 2008 and then dramatically
decreased in the second half of the year to approximately $45 per barrel at December 31, 2008. This
significant fuel price volatility drove the Company’s total fuel hedge losses of more than $1.1 billion in
2008. A significant portion of these losses were unrealized as of December 31, 2008 and could increase or
decrease in future periods based on future changes in market prices before the related hedge contracts
settle. While the Company’s results of operations should benefit significantly from lower fuel prices on its
unhedged fuel consumption, in the near term lower fuel prices could also significantly and negatively
impact liquidity based on the amount of cash settlements and collateral that may be required.
The Company accounts for the majority of its fuel derivative contracts as economic hedges, which
are marked-to-market with gains and losses classified as fuel expense. Remaining fuel derivative
contracts which do not qualify for economic hedge accounting are marked-to-market with gains and
losses classified as nonoperating expense. See Item 7A, “Quantitative and Qualitative Disclosures About
Market Risk” and Note 13, “Fair Value Measurements and Derivative Instruments,” in Combined Notes
to Consolidated Financial Statements for additional details regarding gains and losses from settled and
open positions, cash settlements, unrealized amounts at the end of the period and hedge collateral.
Derivative gains and losses from contracts qualifying for economic hedge accounting are recorded in
mainline fuel expense and are not allocated to United Express fuel expense.
(In millions, except per gallon) 2008 2007 2006 2008 2007 2006
$
Average price per gallon
(in cents)
Mainline fuel purchase cost .................. $7,114 $5,086 $4,798 326.0 221.9 209.5
Non-cash fuel hedge (gains) losses in mainline
fuel ................................... 568 (20) 2 26.0 (0.9) 0.1
Cash fuel hedge (gains) losses in mainline fuel . . . 40 (63) 24 1.9 (2.7) 1.1
Total mainline fuel expense ............... 7,722 5,003 4,824 353.9 218.3 210.7
United Express fuel expense(a) ............... 1,257 915 834 338.8 242.7 223.2
UAL system operating fuel expense .......... $8,979 $5,918 $5,658 351.7 221.7 212.5
Non-cash fuel hedge losses in nonoperating
income (loss) ............................ $ 279 $ — $ —
Cash fuel hedge losses in nonoperating income
(loss) . ................................. 249 — —
Mainline fuel consumption (gallons)............ 2,182 2,292 2,290
Regional affiliates fuel consumption (gallons) .... 371 377 373
Total fuel consumption (gallons)............... 2,553 2,669 2,663
(a) United Express fuel costs are classified as part of Regional affiliate expense.
To ensure adequate supplies of fuel and to provide a measure of control over fuel costs, the
Company arranges to have fuel shipped on major pipelines and stored close to its major hub locations.
Although the Company currently does not anticipate a significant reduction in the availability of jet fuel,
a number of factors make predicting fuel prices and fuel availability uncertain, including changes in
world energy demand, geopolitical uncertainties affecting energy supplies from oil-producing nations,
industrial accidents, threats of terrorism directed at oil supply infrastructure, extreme weather conditions
causing temporary shutdowns of production and refining capacity, as well as changes in relative demand
for other petroleum products that may impact the quantity and price of jet fuel produced from period to
period.
7