United Airlines 2008 Annual Report Download - page 123
Download and view the complete annual report
Please find page 123 of the 2008 United Airlines annual report below. You can navigate through the pages in the report by either clicking on the pages listed below, or by using the keyword search tool below to find specific information within the annual report.-
 1
1 -
2
-
3
-
4
-
5
-
6
-
7
-
8
-
9
-
10
-
11
-
12
-
13
-
14
-
15
-
16
-
17
-
18
-
19
-
20
-
21
-
22
-
23
-
24
-
25
-
26
-
27
-
28
-
29
-
30
-
31
-
32
-
33
-
34
-
35
-
36
-
37
-
38
-
39
-
40
-
41
-
42
-
43
-
44
-
45
-
46
-
47
-
48
-
49
-
50
-
51
-
52
-
53
-
54
-
55
-
56
-
57
-
58
-
59
-
60
-
61
-
62
-
63
-
64
-
65
-
66
-
67
-
68
-
69
-
70
-
71
-
72
-
73
-
74
-
75
-
76
-
77
-
78
-
79
-
80
-
81
-
82
-
83
-
84
-
85
-
86
-
87
-
88
-
89
-
90
-
91
-
92
-
93
-
94
-
95
-
96
-
97
-
98
-
99
-
100
-
101
-
102
-
103
-
104
-
105
-
106
-
107
-
108
-
109
-
110
-
111
-
112
-
 113
113 -
 114
114 -
 115
115 -
 116
116 -
 117
117 -
 118
118 -
 119
119 -
 120
120 -
 121
121 -
 122
122 -
 123
123 -
 124
124 -
 125
125 -
 126
126 -
 127
127 -
 128
128 -
 129
129 -
 130
130 -
 131
131 -
 132
132 -
 133
133 -
134
-
135
-
136
-
137
-
138
-
139
-
140
-
141
-
142
-
143
-
144
-
145
-
146
-
147
-
148
-
149
-
150
-
151
-
152
-
153
-
154
-
155
-
156
-
157
-
158
-
159
 |
 |

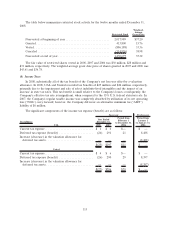
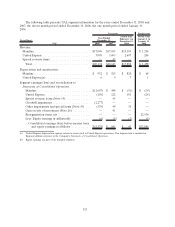
At December 31, 2008 and 2007, UAL’s and United’s net carrying values of mainline and United
Express segment assets were as follows:
(In millions) 2008 2007 2008 2007
UAL United
Mainline segment ............................ $19,415 $24,149 $19,586 $24,165
United Express segment ....................... 46 71 46 71
Total assets ............................... $19,461 $24,220 $19,632 $24,236
United Express assets include only those assets directly associated with its operations. The Company
does not allocate corporate assets to the United Express segment. The Company’s capital expenditures
are reported in the Company’s Statements of Consolidated Cash Flows and are related to its mainline
operations.
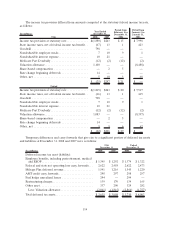
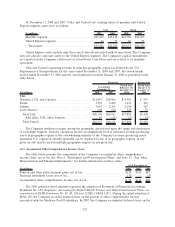
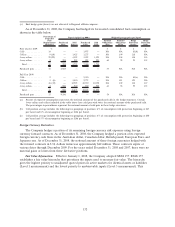
UAL and United’s operating revenue by principal geographic region (as defined by the U.S.
Department of Transportation) for the years ended December 31, 2008 and 2007, the eleven month
period ended December 31, 2006 and the one month period ended January 31, 2006 is presented in the
table below.
(In millions) 2008 2007
Period from
February 1 to
December 31,
2006
Period from
January 1 to
January 31,
2006
Year Ended
December 31,
Successor Predecessor
UAL
Domestic (U.S. and Canada)...................... $12,819 $14,006 $11,981 $ 953
Pacific ....................................... 3,712 3,262 3,214 283
Atlantic ...................................... 3,055 2,365 2,158 167
Latin America ................................. 608 510 529 55
TotalUAL .................................. $20,194 $20,143 $17,882 $1,458
Add (less): UAL other domestic ............... 43 (12) (2) (4)
TotalUnited................................. $20,237 $20,131 $17,880 $1,454
The Company attributes revenue among the geographic areas based upon the origin and destination
of each flight segment. United’s operations involve an insignificant level of dedicated revenue-producing
assets in geographic regions as the overwhelming majority of the Company’s revenue producing assets
(primarily U.S. registered aircraft) generally can be deployed in any of its geographic regions, as any
given aircraft may be used in multiple geographic regions on any given day.
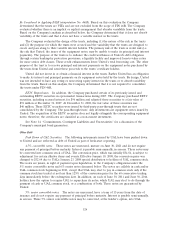
(11) Accumulated Other Comprehensive Income (Loss)
The table below presents the components of the Company’s accumulated other comprehensive
income (loss), net of tax. See Note 9, “Retirement and Postretirement Plans” and Note 13, “Fair Value
Measurements and Financial Instruments,” for further information on these items.
(In millions) 2008 2007 2006
As of December 31,
Pension and other postretirement gains, net of tax .......................... $130 $141 $87
Financial instrument losses, net of tax. . . ................................. (37) — (5)
Accumulated other comprehensive income, net of tax ....................... $ 93 $141 $82
The 2006 pension-related amounts represent the adoption of Statement of Financial Accounting
Standards No. 158, Employers’ Accounting for Defined Benefit Pension and Other Postretirement Plans—an
amendment of FASB Statements No. 87, 88, 106 and 132(R) (“SFAS 158”). During the initial adoption of
SFAS 158, the Company recorded deferred taxes on the portion of other comprehensive income
associated with the Medicare Part D subsidiary. In 2007, the Company recomputed deferred taxes on the
123