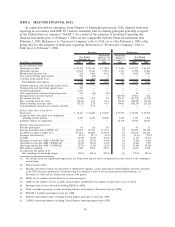
United Airlines 2008 Annual Report Download - page 35
Download and view the complete annual report
Please find page 35 of the 2008 United Airlines annual report below. You can navigate through the pages in the report by either clicking on the pages listed below, or by using the keyword search tool below to find specific information within the annual report.-
 1
1 -
2
-
3
-
4
-
5
-
6
-
7
-
8
-
9
-
10
-
11
-
12
-
13
-
14
-
15
-
16
-
17
-
18
-
19
-
20
-
21
-
22
-
23
-
24
-
 25
25 -
 26
26 -
 27
27 -
 28
28 -
 29
29 -
 30
30 -
 31
31 -
 32
32 -
 33
33 -
 34
34 -
 35
35 -
 36
36 -
 37
37 -
 38
38 -
 39
39 -
 40
40 -
 41
41 -
 42
42 -
 43
43 -
 44
44 -
 45
45 -
46
-
47
-
48
-
49
-
50
-
51
-
52
-
53
-
54
-
55
-
56
-
57
-
58
-
59
-
60
-
61
-
62
-
63
-
64
-
65
-
66
-
67
-
68
-
69
-
70
-
71
-
72
-
73
-
74
-
75
-
76
-
77
-
78
-
79
-
80
-
81
-
82
-
83
-
84
-
85
-
86
-
87
-
88
-
89
-
90
-
91
-
92
-
93
-
94
-
95
-
96
-
97
-
98
-
99
-
100
-
101
-
102
-
103
-
104
-
105
-
106
-
107
-
108
-
109
-
110
-
111
-
112
-
113
-
114
-
115
-
116
-
117
-
118
-
119
-
120
-
121
-
122
-
123
-
124
-
125
-
126
-
127
-
128
-
129
-
130
-
131
-
132
-
133
-
134
-
135
-
136
-
137
-
138
-
139
-
140
-
141
-
142
-
143
-
144
-
145
-
146
-
147
-
148
-
149
-
150
-
151
-
152
-
153
-
154
-
155
-
156
-
157
-
158
-
159
 |
 |
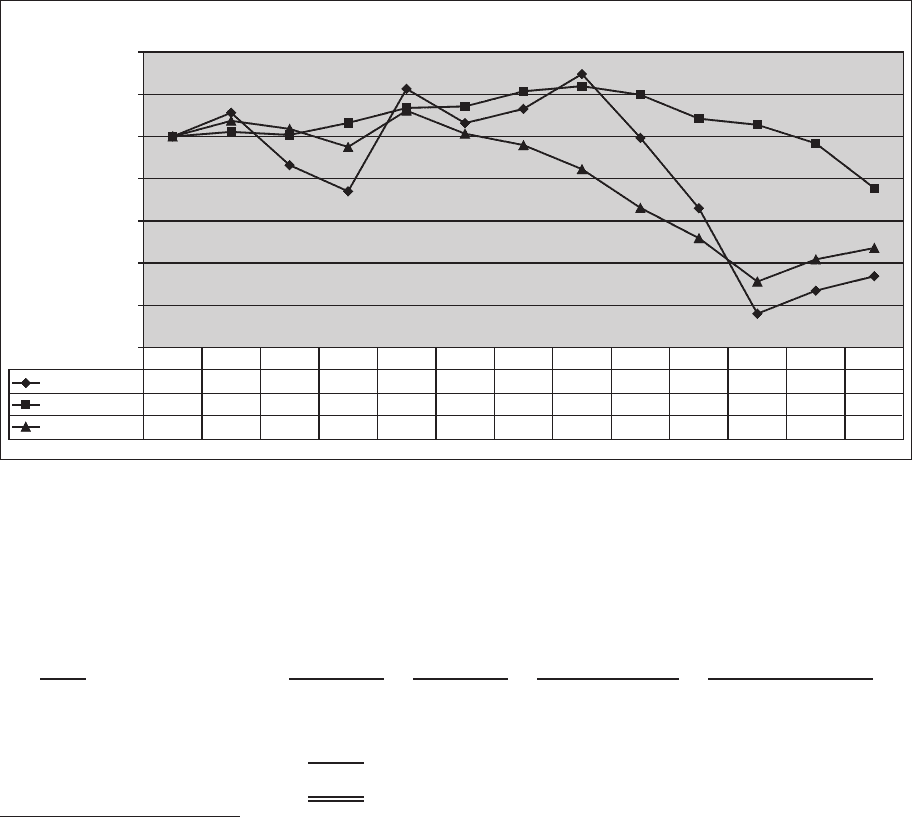
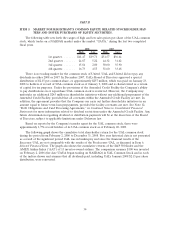
Performance Graph
$-
$20
$40
$60
$80
$100
$120
$140
UAL Corporation 100.00 111.26 86.43 74.03 122.60 106.35 113.10 129.65 99.36 65.98 16.00 26.94 33.77
S&P 500 Index 100.00 102.21 100.75 106.44 113.55 114.28 121.45 123.90 119.78 108.47 105.56 96.76 75.53
AAI Index 100.00 107.45 103.63 95.05 112.29 101.34 95.94 84.53 66.17 51.80 31.21 41.76 47.16
02/02/06 03/31/06 06/30/06 09/30/06 12/31/06 03/31/07 06/30/07 09/30/07 12/31/07 03/31/08 06/30/08 09/30/08 12/31/08
Note: The stock price performance shown in the graph above should not be considered indicative of potential
future stock price performance.
The following table presents repurchases of UAL common stock made in the fourth quarter of fiscal
year 2008:
Period
Total number
of shares
purchased(a)
Average price
paid
per share
Total number of
shares purchased as
part of publicly
announced plans
or programs
Maximum number of
shares (or approximate
dollar value) of shares
that may yet be
purchased under the
plans or programs
10/01/08-10/31/08 ....... 36,111 $14.79 — (b)
11/01/08-11/30/08 ....... 4,000 14.33 — (b)
12/01/08-12/31/08 ....... — — — (b)
Total ................. 40,111 14.74 — (b)
(a) Shares withheld from employees to satisfy certain tax obligations due upon the vesting of restricted stock.
(b) Withholding of shares to satisfy tax obligations due upon the vesting of restricted stock in accordance with the Company’s
share-based compensation plan. The plan does not specify a maximum number of shares that may be repurchased.
35