United Airlines 2008 Annual Report Download - page 133
Download and view the complete annual report
Please find page 133 of the 2008 United Airlines annual report below. You can navigate through the pages in the report by either clicking on the pages listed below, or by using the keyword search tool below to find specific information within the annual report.-
 1
1 -
2
-
3
-
4
-
5
-
6
-
7
-
8
-
9
-
10
-
11
-
12
-
13
-
14
-
15
-
16
-
17
-
18
-
19
-
20
-
21
-
22
-
23
-
24
-
25
-
26
-
27
-
28
-
29
-
30
-
31
-
32
-
33
-
34
-
35
-
36
-
37
-
38
-
39
-
40
-
41
-
42
-
43
-
44
-
45
-
46
-
47
-
48
-
49
-
50
-
51
-
52
-
53
-
54
-
55
-
56
-
57
-
58
-
59
-
60
-
61
-
62
-
63
-
64
-
65
-
66
-
67
-
68
-
69
-
70
-
71
-
72
-
73
-
74
-
75
-
76
-
77
-
78
-
79
-
80
-
81
-
82
-
83
-
84
-
85
-
86
-
87
-
88
-
89
-
90
-
91
-
92
-
93
-
94
-
95
-
96
-
97
-
98
-
99
-
100
-
101
-
102
-
103
-
104
-
105
-
106
-
107
-
108
-
109
-
110
-
111
-
112
-
113
-
114
-
115
-
116
-
117
-
118
-
119
-
120
-
121
-
122
-
 123
123 -
 124
124 -
 125
125 -
 126
126 -
 127
127 -
 128
128 -
 129
129 -
 130
130 -
 131
131 -
 132
132 -
 133
133 -
 134
134 -
 135
135 -
 136
136 -
 137
137 -
 138
138 -
 139
139 -
 140
140 -
 141
141 -
 142
142 -
 143
143 -
144
-
145
-
146
-
147
-
148
-
149
-
150
-
151
-
152
-
153
-
154
-
155
-
156
-
157
-
158
-
159
 |
 |

hierarchy requires entities to maximize the use of observable inputs and minimize the use of
unobservable inputs. The three levels of inputs used to measure fair value are as follows:
Level 1 Unadjusted quoted prices in active markets that are
accessible at the measurement date for identical,
unrestricted assets or liabilities.
Level 2 Observable inputs other than quoted prices included in
Level 1, such as quoted prices for similar assets and
liabilities in active markets; quoted prices for identical or
similar assets and liabilities in markets that are not active;
or other inputs that are observable or can be
corroborated by observable market data.
Level 3 Unobservable inputs that are supported by little or no
market activity and that are significant to the fair value of
the assets or liabilities.
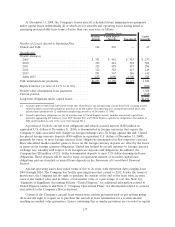
The table below presents disclosures about the fair value of financial assets and financial liabilities
recognized in the Company’s Statements of Consolidated Financial Position.
(In millions)
December 31,
2008
Quoted Prices in
Active Markets
for
Identical Assets
(Level 1)
Significant Other
Observable
Inputs
(Level 2)
Significant
Unobservable
Inputs
(Level 3)
Total
Gains/
(Losses)
(Level 3)(b)
Fair Value Measurements at Reporting Date Using
Assets and Liabilities Measured at Fair
Value on a Recurring Basis:
EETC available-for-sale securities . . . . . $ 46 $— $ — $46 $(37)
Foreign currency receivables . ........ 10 — 10 — —
Total financial assets ............. $ 56 $— $ 10 $46 $(37)
Total financial liabilities—Fuel
derivative payables(a) . . . ........ $(867) $— $(867) $— $ —
(a) The fair value of the fuel hedge derivatives is recorded in other current and noncurrent assets and other current and
noncurrent liabilities in the Company’s Statements of Consolidated Financial Position based on the timing of the contract
settlement dates. As of December 31, 2008, $9 million of the total fuel derivative payable was classified as a noncurrent liabil-
ity. The current fuel trade payable includes $140 million related to counterparty payables for pending settlements of pur-
chased options and expired contracts. See below for further discussion of fuel derivative gains and losses.
(b) During the year ended December 31, 2008, changes in the fair value of Level 3 EETC securities are classified within
“Accumulated other comprehensive income” in the Company’s Statements of Consolidated Financial Position.
Level 3 Financial Assets and Liabilities
(In millions) Available-for-sale securities
Balance at January 1, 2008............ $91
Unrealized gains (losses) relating to
instruments held at reporting date ...... (37)
Returnofprincipal ................... (8)
Balance at December 31, 2008 ......... $46
The Company considered counterparty credit risk in determining the fair value of the financial
instruments shown in the table above. Credit risk did not have a significant impact on the fair values of
fuel derivatives because the Company was required to post $965 million of cash collateral with certain of
its fuel derivative counterparties at December 31, 2008. The current portion of the collateral,
$953 million, is classified as “Fuel hedge collateral deposits” and the noncurrent portion is classified as
“Other assets” in the accompanying Statements of Consolidated Financial Position. The Company
routinely reviews the credit risk associated with its counterparties and believes its collateral is fully
recoverable from its counterparties as of December 31, 2008. Based on the fair value of the Company’s
133