United Airlines 2008 Annual Report Download - page 47
Download and view the complete annual report
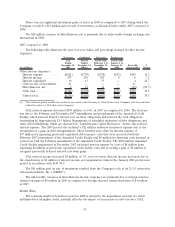
Please find page 47 of the 2008 United Airlines annual report below. You can navigate through the pages in the report by either clicking on the pages listed below, or by using the keyword search tool below to find specific information within the annual report.-
 1
1 -
2
-
3
-
4
-
5
-
6
-
7
-
8
-
9
-
10
-
11
-
12
-
13
-
14
-
15
-
16
-
17
-
18
-
19
-
20
-
21
-
22
-
23
-
24
-
25
-
26
-
27
-
28
-
29
-
30
-
31
-
32
-
33
-
34
-
35
-
36
-
 37
37 -
 38
38 -
 39
39 -
 40
40 -
 41
41 -
 42
42 -
 43
43 -
 44
44 -
 45
45 -
 46
46 -
 47
47 -
 48
48 -
 49
49 -
 50
50 -
 51
51 -
 52
52 -
 53
53 -
 54
54 -
 55
55 -
 56
56 -
 57
57 -
58
-
59
-
60
-
61
-
62
-
63
-
64
-
65
-
66
-
67
-
68
-
69
-
70
-
71
-
72
-
73
-
74
-
75
-
76
-
77
-
78
-
79
-
80
-
81
-
82
-
83
-
84
-
85
-
86
-
87
-
88
-
89
-
90
-
91
-
92
-
93
-
94
-
95
-
96
-
97
-
98
-
99
-
100
-
101
-
102
-
103
-
104
-
105
-
106
-
107
-
108
-
109
-
110
-
111
-
112
-
113
-
114
-
115
-
116
-
117
-
118
-
119
-
120
-
121
-
122
-
123
-
124
-
125
-
126
-
127
-
128
-
129
-
130
-
131
-
132
-
133
-
134
-
135
-
136
-
137
-
138
-
139
-
140
-
141
-
142
-
143
-
144
-
145
-
146
-
147
-
148
-
149
-
150
-
151
-
152
-
153
-
154
-
155
-
156
-
157
-
158
-
159
 |
 |

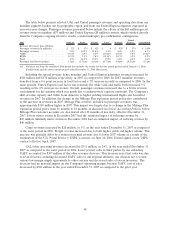
Cargo revenues increased by $84 million, or 11%, in 2008 as compared to 2007, primarily due to
higher fuel surcharges and improved fleet utilization. In addition, revenues were higher due to increased
volume associated with the U.S. domestic mail contract, which commenced in late April 2007, as well as
filling new capacity in international markets. A weaker dollar also benefited cargo revenues in 2008 as a
significant portion of cargo services are contracted in foreign currencies. However, the Company
experienced a significant decline in cargo revenues in the fourth quarter of 2008 due to rationalization of
international capacity, falling demand for domestic and international air cargo as the global economy
softened, and lower fuel costs driving lower fuel surcharges in late 2008. Decreased cargo revenues
resulting from lower demand have a disproportionate impact on our operating results because cargo
revenues typically generate higher margins as compared to passenger revenues.
The full-year 2008 trends in passenger and cargo revenues are not indicative of the Company’s most
recent fourth quarter revenue results. In the fourth quarter of 2008, mainline passenger revenues
decreased approximately 10% due to lower traffic as a result of the Company’s 12% capacity reduction
and lower demand due to the weak global economy. The 2008 capacity reductions, planned 2009 capacity
reductions and weak U.S. and global economies are expected to negatively impact revenues in 2009. In
late 2008 and early 2009, the Company has experienced decreased travel bookings and lower credit card
sales activity which have resulted from the weak global economy and have negatively affected revenues
and are expected to continue to negatively impact revenues in 2009. The Company cannot predict the
longevity or severity of the current weak global economy and, therefore, cannot accurately estimate the
negative impact it will have on future revenues.
Other revenues decreased approximately 11% in 2008 as compared to 2007. This decrease was
primarily due to lower jet fuel sales to third parties. The decrease in third party fuel sales had a
negligible impact on our operating margin because the associated cost of sales decreased by a similar
amount in 2008 as compared to 2007.
2007 compared to 2006
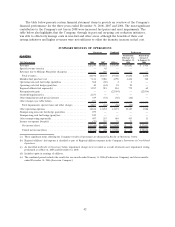
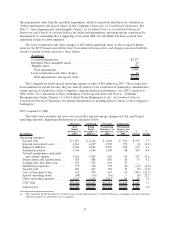
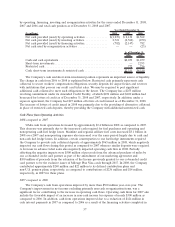
The table below illustrates the year-over-year percentage changes in UAL and United operating
revenues. The primary difference between UAL and United revenues is due to other revenues at UAL,
which are generated from minor direct subsidiaries of UAL.
(In millions)
Period
Ended
December 31,
2007
Period
Ended
December 31,
2006(a)
Period from
February 1 to
December 31,
2006
Period from
January 1 to
January 31,
2006
$
Change
%
Change
Successor Combined Successor Predecessor
Passenger—United Airlines ........ $15,254 $14,367 $13,293 $1,074 $ 887 6.2
Passenger—Regional Affiliates ..... 3,063 2,901 2,697 204 162 5.6
Cargo ......................... 770 750 694 56 20 2.7
Special operating items ........... 45 — — — 45 —
Other operating revenues ......... 1,011 1,322 1,198 124 (311) (23.5)
UAL total.................... $20,143 $19,340 $17,882 $1,458 $ 803 4.2
United total .................. $20,131 $19,334 $17,880 $1,454 $ 797 4.1
(a) The combined 2006 period includes the results for one month ended January 31, 2006 (Predecessor Company) and eleven
months ended December 31, 2006 (Successor Company).
47