Nokia 2014 Annual Report Download - page 8
Download and view the complete annual report
Please find page 8 of the 2014 Nokia annual report below. You can navigate through the pages in the report by either clicking on the pages listed below, or by using the keyword search tool below to find specific information within the annual report.-
 1
1 -
 2
2 -
 3
3 -
 4
4 -
 5
5 -
 6
6 -
 7
7 -
 8
8 -
 9
9 -
 10
10 -
 11
11 -
 12
12 -
 13
13 -
 14
14 -
 15
15 -
 16
16 -
 17
17 -
 18
18 -
 19
19 -
20
-
21
-
22
-
23
-
24
-
25
-
26
-
27
-
28
-
29
-
30
-
31
-
32
-
33
-
34
-
35
-
36
-
37
-
38
-
39
-
40
-
41
-
42
-
43
-
44
-
45
-
46
-
47
-
48
-
49
-
50
-
51
-
52
-
53
-
54
-
55
-
56
-
57
-
58
-
59
-
60
-
61
-
62
-
63
-
64
-
65
-
66
-
67
-
68
-
69
-
70
-
71
-
72
-
73
-
74
-
75
-
76
-
77
-
78
-
79
-
80
-
81
-
82
-
83
-
84
-
85
-
86
-
87
-
88
-
89
-
90
-
91
-
92
-
93
-
94
-
95
-
96
-
97
-
98
-
99
-
100
-
101
-
102
-
103
-
104
-
105
-
106
-
107
-
108
-
109
-
110
-
111
-
112
-
113
-
114
-
115
-
116
-
117
-
118
-
119
-
120
-
121
-
122
-
123
-
124
-
125
-
126
-
127
-
128
-
129
-
130
-
131
-
132
-
133
-
134
-
135
-
136
-
137
-
138
-
139
-
140
-
141
-
142
-
143
-
144
-
145
-
146
-
147
-
148
-
149
-
150
-
151
-
152
-
153
-
154
-
155
-
156
-
157
-
158
-
159
-
160
-
161
-
162
-
163
-
164
-
165
-
166
-
167
-
168
-
169
-
170
-
171
-
172
-
173
-
174
-
175
-
176
-
177
-
178
-
179
-
180
-
181
-
182
-
183
-
184
-
185
-
186
-
187
-
188
-
189
-
190
-
191
-
192
-
193
-
194
-
195
-
196
-
197
-
198
-
199
-
200
-
201
-
202
-
203
-
204
-
205
-
206
-
207
-
208
-
209
-
210
-
211
-
212
-
213
-
214
-
215
-
216
 |
 |

06 NOKIA IN 2014
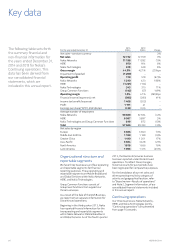
Key data
For the year ended December 31
2014
EURm
2013
EURm Change
Net sales—constant currency 3%
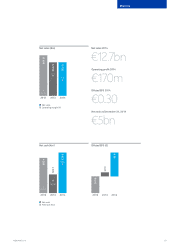
Net sales 12 732 12 709 0%
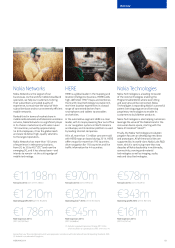
Nokia Networks 11 198 11 282 (1)%
HERE 970 914 6%
Nokia Technologies 578 529 9%
Gross margin 44.3% 42.1% 220bps
Impairment of goodwill (1 209) – –
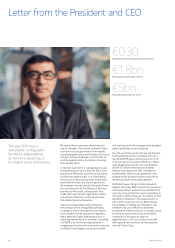
Operating prot 170 519 (67)%
Nokia Networks 1 210 420 188%
HERE (1 241) (154) –
Nokia Technologies 343 310 11%
Group Common Functions (142) (57) 149%
Operating margin 1.3% 4.1% (280)bps
Financial income/(expenses), net (395) (280) 41%
Income tax benet/(expense) 1 408 (202) –
Prot 1 171 41 –
Earnings per share (“EPS”), EUR diluted 0.30 0.05 –
Average number of employees
Nokia Networks 50 680 52 564 (4)%
HERE 6 067 5 897 3%
Nokia Technologies and Group Common Functions 819 872 (6)%
Total 57 566 59 333 (3)%
Net sales by region
Europe 3 886 3 940 (1)%
Middle East & Africa 1 100 1 169 (6)%
Greater China 1 410 1 201 17%
Asia-Pacic 3 364 3 428 (2)%
North America 1 919 1 656 16%
Latin America 1 053 1 315 (20)%
The following table sets forth
thesummary nancial and
non-nancial information for
the years ended December 31,
2014 and 2013 for Nokia’s
Continuing operations. This
data has been derived from
our consolidated nancial
statements, which are
included in this annual report.
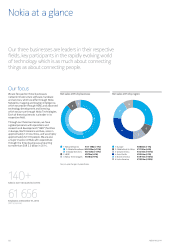
Organizational structure and
reportable segments
We have three businesses and four operating
and reportable segments for nancial
reporting purposes. These operating and
reportable segments are Mobile Broadband
and Global Services within Nokia Networks,
HERE, and Nokia Technologies.
Group Common Functions consist of
Grouplevel functions that support our
threebusinesses.
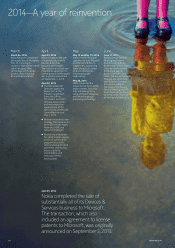
As a result of the Sale of the D&S Business,
wereport certain separate information for
Discontinued operations.
Beginning in the third quarter 2013, Nokia
hasreported nancial information for the
twooperating and reportable segments
within Nokia Networks: Mobile Broadband
andGlobalServices. As of the fourth quarter
2013, the Devices & Services business
hasbeen reported under Discontinued
operations. Toreect these changes,
historical results for past periods have
been regrouped for comparative purposes.
For the breakdown of our net sales and
other operating results by category of
activity and geographical location, refer
to “Board review—Results of operations”
and Note 2, Segment information, of our
consolidated nancial statements included
in this annual report.
Continuing operations
Our three businesses: Nokia Networks,
HERE,and Nokia Technologies (jointly,
“Continuing operations”) are presented
frompage 16 onwards.