Nokia 2014 Annual Report Download - page 56
Download and view the complete annual report
Please find page 56 of the 2014 Nokia annual report below. You can navigate through the pages in the report by either clicking on the pages listed below, or by using the keyword search tool below to find specific information within the annual report.-
 1
1 -
2
-
3
-
4
-
5
-
6
-
7
-
8
-
9
-
10
-
11
-
12
-
13
-
14
-
15
-
16
-
17
-
18
-
19
-
20
-
21
-
22
-
23
-
24
-
25
-
26
-
27
-
28
-
29
-
30
-
31
-
32
-
33
-
34
-
35
-
36
-
37
-
38
-
39
-
40
-
41
-
42
-
43
-
44
-
45
-
 46
46 -
 47
47 -
 48
48 -
 49
49 -
 50
50 -
 51
51 -
 52
52 -
 53
53 -
 54
54 -
 55
55 -
 56
56 -
 57
57 -
 58
58 -
 59
59 -
 60
60 -
 61
61 -
 62
62 -
 63
63 -
 64
64 -
 65
65 -
 66
66 -
67
-
68
-
69
-
70
-
71
-
72
-
73
-
74
-
75
-
76
-
77
-
78
-
79
-
80
-
81
-
82
-
83
-
84
-
85
-
86
-
87
-
88
-
89
-
90
-
91
-
92
-
93
-
94
-
95
-
96
-
97
-
98
-
99
-
100
-
101
-
102
-
103
-
104
-
105
-
106
-
107
-
108
-
109
-
110
-
111
-
112
-
113
-
114
-
115
-
116
-
117
-
118
-
119
-
120
-
121
-
122
-
123
-
124
-
125
-
126
-
127
-
128
-
129
-
130
-
131
-
132
-
133
-
134
-
135
-
136
-
137
-
138
-
139
-
140
-
141
-
142
-
143
-
144
-
145
-
146
-
147
-
148
-
149
-
150
-
151
-
152
-
153
-
154
-
155
-
156
-
157
-
158
-
159
-
160
-
161
-
162
-
163
-
164
-
165
-
166
-
167
-
168
-
169
-
170
-
171
-
172
-
173
-
174
-
175
-
176
-
177
-
178
-
179
-
180
-
181
-
182
-
183
-
184
-
185
-
186
-
187
-
188
-
189
-
190
-
191
-
192
-
193
-
194
-
195
-
196
-
197
-
198
-
199
-
200
-
201
-
202
-
203
-
204
-
205
-
206
-
207
-
208
-
209
-
210
-
211
-
212
-
213
-
214
-
215
-
216
 |
 |

54 NOKIA IN 2014
Results of segments
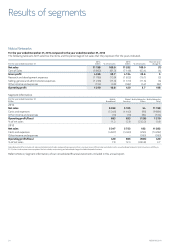
Nokia Networks
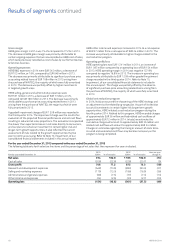
For the year ended December 31, 2014 compared to the year ended December 31, 2013
The following table sets forth selective line items and the percentage of net sales that they represent for the years indicated.
For the year ended December 31
2014
EURm % of net sales
2013
EURm % of net sales
Year-on-year
change %
Net sales 11 198 100.0 11 282 100.0 (1)
Cost of Sales (6 862) (61.3) (7 148) (63.4) (4)
Gross prot 4 336 38.7 4 134 36.6 5
Research and development expenses (1 786) (15.9) (1 822) (16.1) (2)
Selling, general and administrative expenses (1 236) (11.0) (1 310) (11.6) (6)
Other income and expenses (104) (0.9) (582) (5.2) (82)
Operating prot 1 210 10.8 420 3.7 188
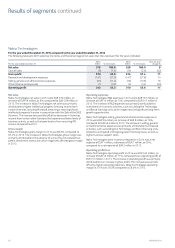
Segment information
For the year ended December 31
EURm
Mobile
Broadband
Global
Services
Nokia Networks
Other
Nokia Networks
Total
2014
Net sales 6 039 5 105 54 11 198
Costs and expenses (5 346) (4 442) (96) (9 884)
Other income and expenses (10) (10) (84) (104)
Operating prot/(loss) 683 653 (126) 1 210
% of net sales 11.3 12.8 (233.3) 10.8
2013
Net sales 5 347 5 753 182 11 282
Costs and expenses (4 927) (5 060) (295) (10 282)
Other income and expenses – – (580) (580)
Operating prot/(loss) 420 693 (693) 420
% of net sales 7.9 12.0 (380.8) 3.7
Nokia Networks Other includes net sales and related cost of sales and operating expenses of non-core businesses, IPR net sales and related costs, as well as Nokia Networks’ Optical business until May 6,
2013, when its divestment was completed. It also includes restructuring and associated charges for Nokia Networks business.
Refer to Note 2, Segment information, of our consolidated nancial statements included in this annual report.