Nokia 2014 Annual Report Download - page 151
Download and view the complete annual report
Please find page 151 of the 2014 Nokia annual report below. You can navigate through the pages in the report by either clicking on the pages listed below, or by using the keyword search tool below to find specific information within the annual report.-
 1
1 -
2
-
3
-
4
-
5
-
6
-
7
-
8
-
9
-
10
-
11
-
12
-
13
-
14
-
15
-
16
-
17
-
18
-
19
-
20
-
21
-
22
-
23
-
24
-
25
-
26
-
27
-
28
-
29
-
30
-
31
-
32
-
33
-
34
-
35
-
36
-
37
-
38
-
39
-
40
-
41
-
42
-
43
-
44
-
45
-
46
-
47
-
48
-
49
-
50
-
51
-
52
-
53
-
54
-
55
-
56
-
57
-
58
-
59
-
60
-
61
-
62
-
63
-
64
-
65
-
66
-
67
-
68
-
69
-
70
-
71
-
72
-
73
-
74
-
75
-
76
-
77
-
78
-
79
-
80
-
81
-
82
-
83
-
84
-
85
-
86
-
87
-
88
-
89
-
90
-
91
-
92
-
93
-
94
-
95
-
96
-
97
-
98
-
99
-
100
-
101
-
102
-
103
-
104
-
105
-
106
-
107
-
108
-
109
-
110
-
111
-
112
-
113
-
114
-
115
-
116
-
117
-
118
-
119
-
120
-
121
-
122
-
123
-
124
-
125
-
126
-
127
-
128
-
129
-
130
-
131
-
132
-
133
-
134
-
135
-
136
-
137
-
138
-
139
-
140
-
 141
141 -
 142
142 -
 143
143 -
 144
144 -
 145
145 -
 146
146 -
 147
147 -
 148
148 -
 149
149 -
 150
150 -
 151
151 -
 152
152 -
 153
153 -
 154
154 -
 155
155 -
 156
156 -
 157
157 -
 158
158 -
 159
159 -
 160
160 -
 161
161 -
162
-
163
-
164
-
165
-
166
-
167
-
168
-
169
-
170
-
171
-
172
-
173
-
174
-
175
-
176
-
177
-
178
-
179
-
180
-
181
-
182
-
183
-
184
-
185
-
186
-
187
-
188
-
189
-
190
-
191
-
192
-
193
-
194
-
195
-
196
-
197
-
198
-
199
-
200
-
201
-
202
-
203
-
204
-
205
-
206
-
207
-
208
-
209
-
210
-
211
-
212
-
213
-
214
-
215
-
216
 |
 |

149
Financial statements
NOKIA IN 2014
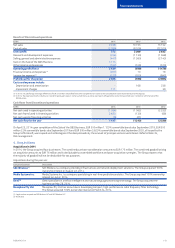
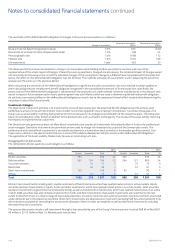
Future cash ows
Employer contributions expected to be made to the post-employment dened benet plans in 2015 are EUR 28 million and the weighted
average duration of the dened benet obligations is 16 years at December 31, 2014.
The expected maturity analysis of undiscounted benets paid from the dened benet plans of the Continuing operations is shown here:
EURm 2015 2016 2017 2018 2019 2020-2024
Pension benets 42 43 45 48 50 316
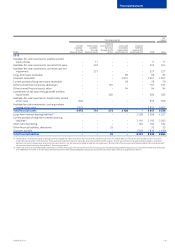
9. Depreciation and amortization by function
EURm 2014 2013 2012
Continuing operations
Cost of sales 61 88 119
Research and development expenses(1) 129 293 525
Selling, general and administrative expenses(2) 107 179 444
Total 297 560 1 088
(1) Includes amortization of acquired intangible assets of EUR 36 million (EUR 188 million in 2013 and EUR 375 million in 2012).
(2) Includes amortization of acquired intangible assets of EUR 40 million (EUR 93 million in 2013 and EUR 313 million in 2012).
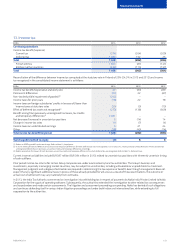
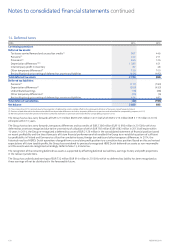
10. Impairment
Impairment charges by asset category are:
EURm 2014 2013 2012
Continuing operations
Goodwill 1 209 – –
Other intangible assets –– 8
Property, plant and equipment –12 23
Investments in associated companies –– 8
Available-for-sale investments 15 831
Total 1 224 20 70
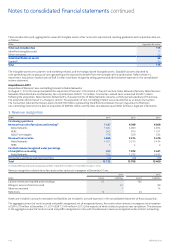
Goodwill
Goodwill impairment assessment for the HERE CGU was carried out at September 30, 2014. The previous assessment date was October 1,
2013. The assessment date was brought forward to September 30, 2014 due to an adjustment to the HERE strategy and the related new
long-range plan, which incorporates the slower than expected increase in net sales directly to consumers, and the Group’s plans to curtail its
investment in certain higher-risk and longer-term growth opportunities. This represented a triggering event resulting in an interim impairment
test to assess if events or changes in circumstances indicate that the carrying amount of HERE goodwill may not be recoverable. The goodwill
impairment assessment for the HERE CGU was rolled forward to October 1, 2014 to align with the annual assessment date. The goodwill
impairment assessment for the Nokia Networks Radio Access Networks group of CGUs in Mobile Broadband and Global Services group of CGUs
was carried out at November 30, 2014 (November 30 in 2013).
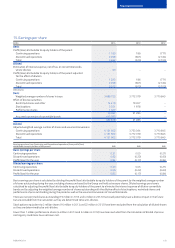
The carrying value of goodwill allocated to each of the Group’s CGUs at each of the respective years’ impairment testing dates is:
EURm 2014 2013
HERE(1) 2 273 3 219
Global Services 106 91
Radio Access Networks in Mobile Broadband 96 88
Devices & Services (Discontinued operations) –1 417
(1) The carrying value of goodwill after the 2014 impairment charge.
The recoverable amounts of the Group’s CGUs were determined using the fair value less costs of disposal method. In the absence of observable
market prices, the recoverable amounts were estimated based on an income approach, specically a discounted cash ow model. The valuation
method is in line with previous years, with the exception that the cash ow forecast period is ve years in comparison with ten years previously.
The cash ow projections used in calculating the recoverable amounts are based on nancial plans approved by management covering an
explicit forecast period of ve years and reect the price that would be received to sell the CGU in an orderly transaction between market
participants at the measurement date. The level of fair value hierarchy within which the fair value measurement is categorized is level 3.
Refer to Note 19, Fair value of nancial instruments for the fair value hierarchy.