Nokia 2014 Annual Report Download - page 55
Download and view the complete annual report
Please find page 55 of the 2014 Nokia annual report below. You can navigate through the pages in the report by either clicking on the pages listed below, or by using the keyword search tool below to find specific information within the annual report.-
 1
1 -
2
-
3
-
4
-
5
-
6
-
7
-
8
-
9
-
10
-
11
-
12
-
13
-
14
-
15
-
16
-
17
-
18
-
19
-
20
-
21
-
22
-
23
-
24
-
25
-
26
-
27
-
28
-
29
-
30
-
31
-
32
-
33
-
34
-
35
-
36
-
37
-
38
-
39
-
40
-
41
-
42
-
43
-
44
-
 45
45 -
 46
46 -
 47
47 -
 48
48 -
 49
49 -
 50
50 -
 51
51 -
 52
52 -
 53
53 -
 54
54 -
 55
55 -
 56
56 -
 57
57 -
 58
58 -
 59
59 -
 60
60 -
 61
61 -
 62
62 -
 63
63 -
 64
64 -
 65
65 -
66
-
67
-
68
-
69
-
70
-
71
-
72
-
73
-
74
-
75
-
76
-
77
-
78
-
79
-
80
-
81
-
82
-
83
-
84
-
85
-
86
-
87
-
88
-
89
-
90
-
91
-
92
-
93
-
94
-
95
-
96
-
97
-
98
-
99
-
100
-
101
-
102
-
103
-
104
-
105
-
106
-
107
-
108
-
109
-
110
-
111
-
112
-
113
-
114
-
115
-
116
-
117
-
118
-
119
-
120
-
121
-
122
-
123
-
124
-
125
-
126
-
127
-
128
-
129
-
130
-
131
-
132
-
133
-
134
-
135
-
136
-
137
-
138
-
139
-
140
-
141
-
142
-
143
-
144
-
145
-
146
-
147
-
148
-
149
-
150
-
151
-
152
-
153
-
154
-
155
-
156
-
157
-
158
-
159
-
160
-
161
-
162
-
163
-
164
-
165
-
166
-
167
-
168
-
169
-
170
-
171
-
172
-
173
-
174
-
175
-
176
-
177
-
178
-
179
-
180
-
181
-
182
-
183
-
184
-
185
-
186
-
187
-
188
-
189
-
190
-
191
-
192
-
193
-
194
-
195
-
196
-
197
-
198
-
199
-
200
-
201
-
202
-
203
-
204
-
205
-
206
-
207
-
208
-
209
-
210
-
211
-
212
-
213
-
214
-
215
-
216
 |
 |

53
Board review
NOKIA IN 2014
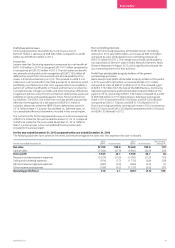
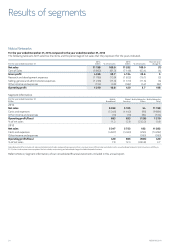
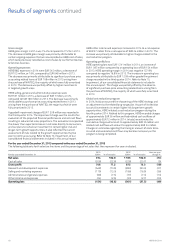
For the year ended December 31, 2013 compared to the year ended December 31, 2012
The following table sets forth selective line items and the percentage of net sales that they represent for years indicated.
For the year ended December 31
2013
EURm % of net sales
2012
EURm % of net sales
Year-on-year
change %
Net sales 10 735 100.0 15 152 100.0 (29)
Cost of sales (8 526) (79.4) (12 320) (81.3) (31)
Gross prot 2 209 20.6 2 832 18.7 (22)
Research and development expenses (1 130) (10.5) (1 658) (10.9) (32)
Selling and marketing expenses (1 345) (12.5) (1 857) (12.3) (28)
Administrative and general expenses (215) (2.0) (286) (1.9) (25)
Other income and expenses (109) (1.0) (510) (3.4) (79)
Operating loss (590) (5.5) (1 479) (9.8) (60)
Net sales
Discontinued operations net sales decreased by 29% to
EUR 10 735 million compared to EUR 15 152 million in 2012. The
decline in discontinued operations net sales in 2013 was primarily due
to lower Mobile Phones net sales and, to a lesser extent, lower Smart
Devices net sales. The decline in Mobile Phones net sales was due to
lower volumes and average selling prices, aected by competitive
industry dynamics, including intense smartphone competition at
increasingly lower price points and intense competition at the low end
of our product portfolio. The decline in Smart Devices net sales was
primarily due to lower volumes, aected by competitive industry
dynamics, including the strong momentum of competing smartphone
platforms, as well as our portfolio transition from Symbian products
to Lumia products.
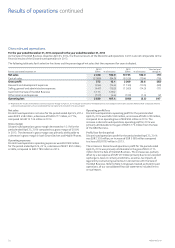
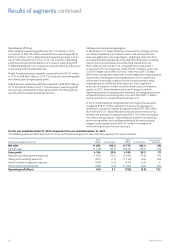
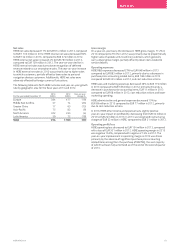
The following table sets forth the distribution by geographical area
of our net sales for the scal years 2013 and 2012.
For the year ended December 31
2013
EURm
2012
EURm
Year-on-year
change %
Europe 3 266 4 498 (27)
Middle East & Africa 1 689 2 712 (38)
Greater China 816 1 519 (46)
Asia-Pacic 2 691 3 655 (26)
North America 623 532 17
Latin America 1 650 2 236 (26)
Total 10 735 15 152 (29)
Gross margin
Discontinued operations gross margin improved to 20.6% in 2013
compared to 18.7% in 2012. The increase in gross margin in 2013 was
primarily due to a higher Smart Devices gross margin, partially oset
by slightly lower Mobile Phones gross margin. The increase in Smart
Devices gross margin was primarily due to lower inventory related
allowances, which adversely aected Smart Devices gross margin
in2012.
Operating expenses
Discontinued operations operating expenses were EUR 2 799 million
in 2013, compared to EUR 4 311 million in 2012. The 35% decrease
in 2013 was due to lower Mobile Phones and Smart Devices operating
expenses, primarily due to structural cost savings, as well as overall
cost controls.
Operating prot/loss
Discontinued operations operating margin improved to negative 5.5%
in 2013 compared to negative 9.8% in 2012. The improvement was
primarily due to structural cost savings, as well as overall cost controls,
and a higher gross margin.