Nokia 2014 Annual Report Download - page 66
Download and view the complete annual report
Please find page 66 of the 2014 Nokia annual report below. You can navigate through the pages in the report by either clicking on the pages listed below, or by using the keyword search tool below to find specific information within the annual report.-
 1
1 -
2
-
3
-
4
-
5
-
6
-
7
-
8
-
9
-
10
-
11
-
12
-
13
-
14
-
15
-
16
-
17
-
18
-
19
-
20
-
21
-
22
-
23
-
24
-
25
-
26
-
27
-
28
-
29
-
30
-
31
-
32
-
33
-
34
-
35
-
36
-
37
-
38
-
39
-
40
-
41
-
42
-
43
-
44
-
45
-
46
-
47
-
48
-
49
-
50
-
51
-
52
-
53
-
54
-
55
-
 56
56 -
 57
57 -
 58
58 -
 59
59 -
 60
60 -
 61
61 -
 62
62 -
 63
63 -
 64
64 -
 65
65 -
 66
66 -
 67
67 -
 68
68 -
 69
69 -
 70
70 -
 71
71 -
 72
72 -
 73
73 -
 74
74 -
 75
75 -
 76
76 -
77
-
78
-
79
-
80
-
81
-
82
-
83
-
84
-
85
-
86
-
87
-
88
-
89
-
90
-
91
-
92
-
93
-
94
-
95
-
96
-
97
-
98
-
99
-
100
-
101
-
102
-
103
-
104
-
105
-
106
-
107
-
108
-
109
-
110
-
111
-
112
-
113
-
114
-
115
-
116
-
117
-
118
-
119
-
120
-
121
-
122
-
123
-
124
-
125
-
126
-
127
-
128
-
129
-
130
-
131
-
132
-
133
-
134
-
135
-
136
-
137
-
138
-
139
-
140
-
141
-
142
-
143
-
144
-
145
-
146
-
147
-
148
-
149
-
150
-
151
-
152
-
153
-
154
-
155
-
156
-
157
-
158
-
159
-
160
-
161
-
162
-
163
-
164
-
165
-
166
-
167
-
168
-
169
-
170
-
171
-
172
-
173
-
174
-
175
-
176
-
177
-
178
-
179
-
180
-
181
-
182
-
183
-
184
-
185
-
186
-
187
-
188
-
189
-
190
-
191
-
192
-
193
-
194
-
195
-
196
-
197
-
198
-
199
-
200
-
201
-
202
-
203
-
204
-
205
-
206
-
207
-
208
-
209
-
210
-
211
-
212
-
213
-
214
-
215
-
216
 |
 |
64 NOKIA IN 2014
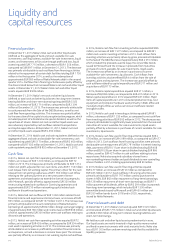
Financial position
At December 31, 2014 Nokia’s total cash and other liquid assets
(dened as the aggregate of bank and cash; available-for-sale
investments, cash equivalents; available-for-sale investments, liquid
assets; and investments at fair value through prot and loss, liquid
assets) equaled EUR 7 715 million, a decrease of EUR 1 256 million,
compared to EUR 8 971 million at December 31, 2013. The decrease
was primarily attributable to cash outows from nancing activities
related to the repayment of certain debt facilities totaling EUR 1 750
million in the rst quarter 2014, as well as the redemption of
approximately EUR 950 million of Nokia Networks debt in the second
quarter 2014. Outows from nancing activities were partly oset by
the drivers listed below that increased Nokia’s net cash and other liquid
assets. At December 31, 2012 Nokia’s total cash and other liquid
assets equaled EUR 9 909 million.
At December 31, 2014 Nokia’s net cash and other liquid assets
(dened as total cash and other liquid assets less long-term interest
bearing liabilities and short-term borrowings) equaled EUR 5 023
million, an increase of EUR 2 714 million, compared to EUR 2 309
million at December 31, 2013. The increase was primarily attributable
to cash proceeds from the Sale of the D&S Business, as well as net
cash ow from operating activities. This increase was partially oset
by the execution of the capital structure optimization program, which
included payment of a dividend and a special dividend, as well as the
repurchase of shares. Nokia’s net cash and other liquid assets was
also adversely impacted by cash outows related to acquisitions
and capital expenditures. At December 31, 2012, Nokia’s net cash
and other liquid assets equaled EUR 4 360 million.
At December 31, 2014 Nokia’s cash and cash equivalents (dened as the
aggregate of bank and cash and available-for-sale investments, cash
equivalents) equaled EUR 5 170 million, a decrease of EUR 2 463 million,
compared to EUR 7 633 million at December 31, 2013. Nokia’scash and
cash equivalents equaled EUR 8 952 million at December 31, 2012.
Cash ow
In 2014, Nokia’s net cash from operating activities equaled EUR 1 275
million, an increase of EUR 1 203 million, as compared to EUR 72
million in 2013. The increase was primarily attributable to EUR 1 214
million net prot, adjusted for non-cash items and a EUR 1 153 million
cash release from net working capital. The primary driver for the cash
release from net working capital was a EUR 1 650 million cash inow
relating to the upfront payment on a ten-year patent license
agreement and related option to extend the license into perpetuity
with Microsoft, partially oset by approximately EUR 320 million
restructuring related cash outows in Continuing operations and
approximately EUR 210 million net working capital related cash
outows in discontinued operations.
In 2014, Nokia had cash outows of EUR 1 092 million related to net
nancial income and expenses and income taxes, an increase of EUR
935 million, as compared to EUR 157 million in 2013. The increase was
primarily attributable to the early redemption of Nokia Networks’
borrowings of approximately EUR 84 million, foreign exchange hedging
of approximately EUR 180 million and income taxes of EUR 636 million,
of which approximately EUR 300 million were cash outows relating to
discontinued operations.
In 2013, Nokia’s net cash from operating activities equaled EUR 72
million, an increase of EUR 426 million, as compared to EUR 354 million
cash used in operating activities in 2012. The increase was primarily
attributable to an increase in protability and other nancial income
and expenses, net and a decrease in income taxes paid. The increase
was partially oset by an increase in net working capital cash outows.
In 2014, Nokia’s cash ow from investing activities equaled EUR 886
million, an increase of EUR 1 577 million, as compared to EUR 691
million cash used in investing activities in 2013. Cash inows from
investing activities was primarily driven by gross proceeds attributable
to the Sale of the D&S Business of approximately EUR 4 010 million,
which included the proceeds used to repay the convertible bonds
issued to Microsoft and the increase in proceeds from maturities
and sale of current available-for-sale investments, liquid assets.
The increase was oset by an increase in purchases of current
available-for-sale investments, liquid assets. Cash inows from
investing activities also benetted EUR 44 million from the sale of
property, plant and equipment. The increase was partially oset by
cash outows related to capital expenditure of EUR 311 million and
acquisitions of EUR 175 million.
In 2014, Nokia’s capital expenditure equaled EUR 311 million, a
decrease of EUR 96 million, as compared to EUR 407 million in 2013.
Nokia’s capital expenditure in 2012 equaled EUR 461 million. Major
items of capital expenditure in 2014 included production lines, test
equipment and computer hardware used primarily in R&D, oce and
manufacturing facilities as well as services and software related
intangible assets.
In 2013, Nokia’s cash used in investing activities equaled EUR 691
million, a decrease of EUR 1 253 million, as compared to net cash ow
from investing activities of EUR 562 million in 2012. The decrease was
primarily attributable to signicantly lower proceeds from the sale and
maturities of current available-for-sale investments, liquid assets
partially, oset by a decrease in purchases of current available-for-sale
investments, liquid assets.
In 2014, Nokia’s cash ow used in nancing activities equaled EUR 4
576 million, an increase of EUR 4 099 million, as compared to EUR 477
million in 2013. Cash outows from nancing activities were primarily
attributable to the repayment of EUR 2 791 million in interest-bearing
debt, payments of EUR 0.11 per share in dividend totaling EUR 408
million and EUR 0.26 per share in special dividend totaling EUR 966
million, as well as EUR 427 million in cash outows relating to share
repurchases. Nokia also acquired subsidiary shares from a
non-controlling interest holder and paid dividends to non-controlling
interest holders in 2014 totaling approximately EUR 60 million.
In 2013, Nokia’s cash ow used in nancing activities equaled
EUR 477 million, an increase of EUR 12 million as compared to
EUR 465 million in 2012. Cash outows in nancing activities were
primarily attributable to EUR 1 707 million used to purchase the
shares in NSN, EUR 862 million repayment of long-term borrowings,
EUR 128 million repayment of short-term borrowings and EUR 71
million payment of dividends, oset by EUR 2 291 million in proceeds
from long-term borrowings, which included EUR 1 500 million
convertible bonds issued to Microsoft and EUR 450 million and
EUR 350 million bonds due in 2018 and in 2020, respectively,
issued by Nokia Networks.
Financial assets and debt
At December 31, 2014 Nokia’s net cash equaled EUR 5 023 million
and consisted of EUR 7 715 million in total cash and other liquid assets
and EUR 2 692 million of long-term interest bearing liabilities and
short-term borrowings.
We hold our cash and other liquid assets predominantly in euro.
Our liquid assets are mainly invested in high-quality money market
and xed income instruments with strict maturity limits. Nokia also
has a EUR 1 500 million undrawn revolving credit facility available for
liquidity purposes.
Liquidity and
capital resources