Nokia 2014 Annual Report Download - page 103
Download and view the complete annual report
Please find page 103 of the 2014 Nokia annual report below. You can navigate through the pages in the report by either clicking on the pages listed below, or by using the keyword search tool below to find specific information within the annual report.-
 1
1 -
2
-
3
-
4
-
5
-
6
-
7
-
8
-
9
-
10
-
11
-
12
-
13
-
14
-
15
-
16
-
17
-
18
-
19
-
20
-
21
-
22
-
23
-
24
-
25
-
26
-
27
-
28
-
29
-
30
-
31
-
32
-
33
-
34
-
35
-
36
-
37
-
38
-
39
-
40
-
41
-
42
-
43
-
44
-
45
-
46
-
47
-
48
-
49
-
50
-
51
-
52
-
53
-
54
-
55
-
56
-
57
-
58
-
59
-
60
-
61
-
62
-
63
-
64
-
65
-
66
-
67
-
68
-
69
-
70
-
71
-
72
-
73
-
74
-
75
-
76
-
77
-
78
-
79
-
80
-
81
-
82
-
83
-
84
-
85
-
86
-
87
-
88
-
89
-
90
-
91
-
92
-
 93
93 -
 94
94 -
 95
95 -
 96
96 -
 97
97 -
 98
98 -
 99
99 -
 100
100 -
 101
101 -
 102
102 -
 103
103 -
 104
104 -
 105
105 -
 106
106 -
 107
107 -
 108
108 -
 109
109 -
 110
110 -
 111
111 -
 112
112 -
 113
113 -
114
-
115
-
116
-
117
-
118
-
119
-
120
-
121
-
122
-
123
-
124
-
125
-
126
-
127
-
128
-
129
-
130
-
131
-
132
-
133
-
134
-
135
-
136
-
137
-
138
-
139
-
140
-
141
-
142
-
143
-
144
-
145
-
146
-
147
-
148
-
149
-
150
-
151
-
152
-
153
-
154
-
155
-
156
-
157
-
158
-
159
-
160
-
161
-
162
-
163
-
164
-
165
-
166
-
167
-
168
-
169
-
170
-
171
-
172
-
173
-
174
-
175
-
176
-
177
-
178
-
179
-
180
-
181
-
182
-
183
-
184
-
185
-
186
-
187
-
188
-
189
-
190
-
191
-
192
-
193
-
194
-
195
-
196
-
197
-
198
-
199
-
200
-
201
-
202
-
203
-
204
-
205
-
206
-
207
-
208
-
209
-
210
-
211
-
212
-
213
-
214
-
215
-
216
 |
 |

101
Corporate governance
NOKIA IN 2014
Equity awards to other eligible employees are approved by the President and CEO on a quarterly basis, based on an authorization given by
the Board.
At December 31, 2014, the total dilutive eect of all Nokia’s stock options, performance shares and restricted shares outstanding, assuming
full dilution, was approximately 1.37% in the aggregate. The potential maximum eect of the 2015 Equity Plans would be approximately
another 0.97%.
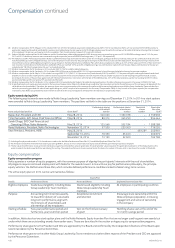
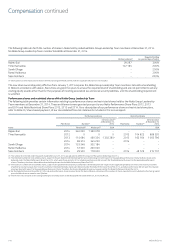
Performance shares
The performance shares represent a commitment by Nokia to deliver Nokia shares to employees at a future point in time, subject to Nokia’s
fulllment of pre-dened performance criteria. The shares have a two-year performance period followed by a further one-year restriction
period after which the awards vest. The table below illustrates the performance criteria of the Performance Share Plans as of 2012 through
to2014.
Performance criteria (non-IFRS)(1) 2014 2013 2012
For Nokia Group employees (excluding HERE employees)
Average annual net sales Nokia Group Yes Yes(2) Yes
Average annual EPS Nokia Group Yes Yes Yes
For HERE employees(3)
Average annual EPS Nokia Group Yes n/a n/a
Average annual net sales HERE Yes n/a n/a
Average annual operating prot HERE Yes n/a n/a
Minimum settlement at below threshold performance(4) 25% 0% 0%
(1) Non-IFRS measures exclude all material special items for all periods. In addition, non-IFRS results exclude intangible asset amortization and other purchase price accounting-related items arising from
business acquisitions.
(2) The performance condition was amended at the time of the Sale of the D&S Business to reect the new prole of the business and dierent annual revenue levels of the new business. The amendment
introduces a metric set on the basis of the Average Net Sales Index over the two-year performance period in replacement of the metric set on the basis of the Average Annual Net Sales Revenue. The
‘Net Sales Index’ relates to the nal non-IFRS annual net sales achieved through the business operations of Nokia Group (excluding Nokia Networks) in relation to 2013 and for Nokia Networks, HERE and
Nokia Technologies in relation to 2014, expressed as a percentage of the annual target set for each year. A separate Annual Net Sales Index will be calculated for 2013 and 2014, and the average of the
two will be calculated following the close of 2014 and used, in part, to determine the nal payout under the Plan, which will occur after the one-year restriction period in 2016.
(3) Specic performance criteria for HERE employees were introduced in 2014.
(4) In 2014, a minimum payout level was introduced to reinforce the retentive impact of the plan by giving some certainty to remaining employees during the transformation of Nokia following the Sale of
the D&S Business and integration of the Nokia Networks business.
Until the shares have vested and been delivered to the participants, they carry no voting or dividend rights. The performance share grants are
generally forfeited if the employment relationship terminates with Nokia prior to vesting.
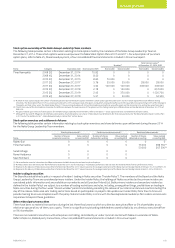
Performance Share Plan 2015
The primary equity incentive instrument for the executives and other selected employees in 2015 will again be performance shares. The
approximate maximum numbers of planned grants under the Nokia Performance Share Plan 2015 is 32 220 000 units. The minimum number
of grant units is 8 055 000.
As in 2014, the number of shares to be settled after the restriction period will start at 25% of the grant amount and any payout beyond
this will be determined with reference to the nancial performance against the established performance criteria during the two-year
performance period.
The Nokia Performance Share Plan 2015 has a two-year performance period (2015 through to 2016) and a subsequent one-year restriction
period. Therefore, the amount of shares based on the nancial performance during 2015–2016 will vest after 2017. The performance criteria
and range for Nokia Group employees (excluding HERE employees) are as follows:
Performance criterion Weighting Threshold performance Maximum performance Potential range of settlement
Nokia average annual non-IFRS(1) net sales
during Jan.1, 2015—Dec. 31, 2016 50% EURm 12 389 EURm 14 736
Threshold number up to maximum
level (4 x Threshold number)
Nokia average annual non-IFRS(1) EPS
during Jan.1, 2015—Dec. 31, 2016 50% EUR 0.23 EUR 0.37
Threshold number up to maximum
level (4 x Threshold number)
The performance criteria and range for HERE employees are as follows:
Performance criterion Weighting Threshold performance Maximum performance Potential range of settlement
Nokia average annual non-IFRS(1) EPS
during Jan.1, 2015—Dec. 31, 2016 25% EUR 0.23 EUR 0.37
Threshold number up to maximum
level (4 x Threshold number)
HERE non-IFRS(1) average annual operating
prot during Jan.1, 2015—Dec. 31, 2016 25% EURm 66.5 EURm 172
Threshold number up to maximum
level (4 x Threshold number)
HERE average annual non-IFRS(1) net sales
during Jan.1, 2015—Dec. 31, 2016 50% EURm 953.5 EURm 1 133.5
Threshold number up to maximum
level (4 x Threshold number)
(1) Non-IFRS measures exclude all material special items for all periods. In addition, non-IFRS results exclude intangible asset amortization and other purchase price accounting-related items arising from
business acquisitions.