Nokia 2014 Annual Report Download - page 49
Download and view the complete annual report
Please find page 49 of the 2014 Nokia annual report below. You can navigate through the pages in the report by either clicking on the pages listed below, or by using the keyword search tool below to find specific information within the annual report.-
 1
1 -
2
-
3
-
4
-
5
-
6
-
7
-
8
-
9
-
10
-
11
-
12
-
13
-
14
-
15
-
16
-
17
-
18
-
19
-
20
-
21
-
22
-
23
-
24
-
25
-
26
-
27
-
28
-
29
-
30
-
31
-
32
-
33
-
34
-
35
-
36
-
37
-
38
-
 39
39 -
 40
40 -
 41
41 -
 42
42 -
 43
43 -
 44
44 -
 45
45 -
 46
46 -
 47
47 -
 48
48 -
 49
49 -
 50
50 -
 51
51 -
 52
52 -
 53
53 -
 54
54 -
 55
55 -
 56
56 -
 57
57 -
 58
58 -
 59
59 -
60
-
61
-
62
-
63
-
64
-
65
-
66
-
67
-
68
-
69
-
70
-
71
-
72
-
73
-
74
-
75
-
76
-
77
-
78
-
79
-
80
-
81
-
82
-
83
-
84
-
85
-
86
-
87
-
88
-
89
-
90
-
91
-
92
-
93
-
94
-
95
-
96
-
97
-
98
-
99
-
100
-
101
-
102
-
103
-
104
-
105
-
106
-
107
-
108
-
109
-
110
-
111
-
112
-
113
-
114
-
115
-
116
-
117
-
118
-
119
-
120
-
121
-
122
-
123
-
124
-
125
-
126
-
127
-
128
-
129
-
130
-
131
-
132
-
133
-
134
-
135
-
136
-
137
-
138
-
139
-
140
-
141
-
142
-
143
-
144
-
145
-
146
-
147
-
148
-
149
-
150
-
151
-
152
-
153
-
154
-
155
-
156
-
157
-
158
-
159
-
160
-
161
-
162
-
163
-
164
-
165
-
166
-
167
-
168
-
169
-
170
-
171
-
172
-
173
-
174
-
175
-
176
-
177
-
178
-
179
-
180
-
181
-
182
-
183
-
184
-
185
-
186
-
187
-
188
-
189
-
190
-
191
-
192
-
193
-
194
-
195
-
196
-
197
-
198
-
199
-
200
-
201
-
202
-
203
-
204
-
205
-
206
-
207
-
208
-
209
-
210
-
211
-
212
-
213
-
214
-
215
-
216
 |
 |

47
Board review
NOKIA IN 2014
Results of operations
The nancial data included in this “Board review” section at and for the
year ended December 31, 2013 and2014 and for each of the years in
the three-year period ended December 31, 2014 has been derived
from our audited consolidated nancial statements included in this
annual report. The nancial data at December 31, 2013 and 2014 and
for each of the years in the three-year period ended December 31,
2014 should be read in conjunction with, and are qualied in
their entirety by reference to, our audited consolidated nancial
statements.
Continuing operations
For the year ended December 31, 2014 compared to the year ended December 31, 2013
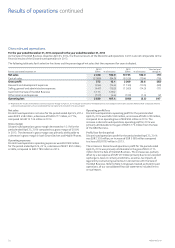
The following table sets forth selective line items and the percentage of net sales that they represent for the years indicated.
For the year ended December 31
2014
EURm % of net sales
2013
EURm % of net sales
Year-on-year
change %
Net sales 12 732 100.0 12 709 100.0 0
Cost of sales (7 094) (55.7) (7 364) (57.9) (4)
Gross prot 5 638 44.3 5 345 42.1 6
Research and development expenses (2 493) (19.6) (2 619) (20.6) (5)
Selling, general and administrative expenses (1 634) (12.8) (1 671) (13.1) (2)
Impairment of goodwill (1 209) (9.5) – –
Other income and expenses (132) (1.0) (536) (4.2) (75)
Operating prot 170 1.3 519 4.1 (67)
Net sales
Continuing operations’ net sales in 2014 were EUR 12 732 million,
an increase of EUR 23 million compared to EUR 12 709 million in 2013.
The increase in Continuing operations’ net sales was primarily
attributable to higher net sales in HERE and Nokia Technologies.
Theincrease was partially oset by a slight decrease in net sales
in Nokia Networks.
The increase in net sales in HERE was primarily attributable to higher
sales to vehicle customers and Microsoft becoming a more signicant
licensee of HERE’s services. The increase in net sales in Nokia
Technologies was primarily attributable to higher intellectual property
licensing income from certain licensees, including Microsoft becoming
a more signicant intellectual property licensee in conjunction with the
Sale of the D&S Business. The slight decrease in net sales in Nokia
Networks was primarily attributable to a decrease in net sales in Global
Services, as well as the absence of sales from businesses that were
divested and certain customer contracts and countries that were
exited in 2013. The decrease in net sales in Global Services was
partially oset by an increase in net sales in Mobile Broadband.
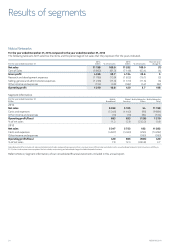
The following table sets forth the distribution by geographical area of
net sales for the years indicated.
For the year ended December 31
2014
EURm
2013
EURm
Year-on-year
change %
Europe(1) 3 886 3 940 (1)
Middle East & Africa 1 100 1 169 (6)
Greater China 1 410 1 201 17
Asia-Pacic 3 364 3 428 (2)
North America 1 919 1 656 16
Latin America 1 053 1 315 (20)
Total 12 732 12 709 0
(1) All Nokia Technologies net sales are allocated to Finland.
Refer to “Results of segments—Nokia Networks” for the main changes in the regional net sales.
Gross margin
Gross margin for Continuing operations in 2014 was 44.3% compared
to 42.1% in 2013. The increase in Continuing operations gross margin
was primarily attributable to the increase in gross margin in Nokia
Networks. The increase was partially oset by a decrease in gross
margin in HERE.
The increase in gross margin in Nokia Networks was primarily
attributable to a higher proportion of Mobile Broadband in the
overall sales mix and an increase in gross margin in Global Services
was partially oset by a slight decrease in gross margin in Mobile
Broadband. The decrease in gross margin in HERE was primarily due
to certain ongoing expenses that had been previously borne by our
former Devices & Services business.